Inpatient Endpoints in Pragmatic Clinical Trials

Choosing and Specifying Endpoints and Outcomes


Section 4

Inpatient Endpoints in Pragmatic Clinical Trials

Pragmatic Trial Inpatient Endpoints

In a traditional explanatory trial, data are collected on a case report form (CRF) usually by a study coordinator, but this can be an expensive and inefficient mechanism for gathering data. Explanatory trials also may include outcomes and endpoints that are not typically captured in clinical practice and may not be familiar to health care practitioners. In contrast, embedded pragmatic clinical trials (ePCTs) usually do not rely upon study coordinators for data collection and tend to focus on outcomes that are “directly relevant to participants, funders, communities, and healthcare practitioners (Califf and Sugarman 2015). Pragmatic trials approaches for acquiring patient information may include a variety of data sources (e.g., electronic health records, medical claims and billing data, product and disease registries), patient-reported data, outcomes or surveys, and/or data gathered from wearables or other devices(e.g., mobile phones) (U.S. Food and Drug Administration 2018). These data sources vary in their availability and differ in the type and extent of error and bias they introduce, which can influence study design and results. These differences must be considered when using “real-world” data to ascertain inpatient events.

When an inpatient event is a PCT endpoint, the data necessary to answer a particular research question might vary depending on the level of specificity required. It might be enough to know that the patient was hospitalized in the last six months, or it might be important to know the reason for the hospitalization (e.g., the patient was hospitalized for a heart attack). It may also be necessary to define inpatient events so that they are more meaningful for practitioners and amenable to capture in real-world data sources. In other words, to be more pragmatic in data collection, an investigator may need to be more pragmatic in defining events.

In this section, we will define how inpatient events are classified, describe the different data sources that can be used for inpatient event ascertainment and include information from the literature (where possible) about the reliability of these data sources. For most PCTs, a hybrid approach that uses more than one data source may be the best way to get reliable information as inexpensively as possible (Perkins et al. 2000). We also will provide case studies of pragmatic trials that use inpatient events as endpoints, and propose methods for evaluating the relative accuracy of different inpatient event data collection methods.

Role of inpatient endpoints

In certain therapeutic areas, inpatient events may capture the progression of disease, but this can be an imprecise assessment. Patients can be hospitalized for many reasons. Therefore, depending on what is needed for a trial, just the occurrence of a patient hospitalization may not provide sufficient information.

Current concepts about what constitutes inpatient and outpatient endpoints are grounded in Medicare’s part A and B definitions. Medicare defines hospital status as follows:

  • An inpatient stay is when a patient is formally admitted to a hospital. “An inpatient admission is generally appropriate for payment under Medicare Part A when you’re expected to need 2 or more midnights of medically necessary hospital care, but your doctor must order this admission and the hospital must formally admit you for you to become an inpatient (Centers for Medicare and Medicaid Services 2018)”
  • An outpatient stay includes emergency department services, observation services, outpatient surgery, lab tests, X-rays, or any other hospital services when the doctor hasn’t written an order to admit a patient to a hospital, even if the patient stays overnight (Centers for Medicare and Medicaid Services 2018).

Other inpatient care, such as stays in rehab and skilled nursing facilities, are defined differently. Further, over the years, as inpatient census acuity has steadily risen in recent years, some care that used to be inpatient, such as diagnostic catheterization and percutaneous coronary intervention, can occur at a hospital, but is considered outpatient (observational) care if the patient stay is not long enough to be considered inpatient. The definition of inpatient care is changing, and there are also regional and health-system related variations in how inpatient care is defined and provided. Therefore, investigators may need to consider not only inpatient stays for outcome ascertainment, but also observation stays and emergency department visits for events that may be equivalent to a hospitalization.

For more, see the article from Medicare: Inpatient or outpatient hospital status affects your costs

How endpoints are classified

Hospitalization endpoints may be classified differently depending on diagnosis. For example, in the 2017 Cardiovascular and Stroke Endpoints for Clinical Trials the definitions for cardiovascular death, myocardial infarction, coronary artery bypass surgery, and stroke do not include the word “hospitalization” (Hicks et al. 2018), although it is likely that the patient was hospitalized for these conditions. The endpoint definitions that explicitly include the term: “hospitalization” are for the conditions that are more challenging to diagnose, i.e., “hospitalization for unstable angina” and “hospitalization for heart failure.” For diseases like cancer, hospitalization is not a common endpoint. Rather, endpoints are based on the progression of the disease. Recommended endpoints for cancer include disease-free survival, time to progression and progression-free survival, and treatment failure (U.S. Department of Health and Human Services 2018). Taking another approach, an FDA perspective on clinical trial endpoints focuses on direct endpoints (survival, symptoms, functioning) and indirect endpoints (biomarkers, walk tests, and tumor size) and does not focus on hospitalization per se (Burke 2012). Nonetheless, many FDA endpoints will occur in an inpatient setting and will require inpatient data for their determination.

In some cases, a hospitalization can be a marker of disease progression, and in other cases, a hospitalization can mean that a patient is getting well enough for treatment. As an example, consider acute heart failure syndrome, where there is a general lack of agreement about appropriate endpoints (Allen et al. 2009). As articulated by Allen et al., there are a number of reasons why hospital stay endpoints are challenging in patients with acute heart failure:

  • Preferences regarding staying in hospitals differ across patients
  • Regional practice patterns vary
  • Patients with a long index hospital stay are less at risk for a repeat hospital stay, because they have less time out of the hospital
  • Patients who do not survive are also not at risk for a repeat hospital stay (Allen et al. 2009).

In recent years, systems have been aiming to take care of more heart failure patients outside the hospital setting, which is in line with patient preferences. Thus, meaningful endpoints are aligning with how systems care for patients and what patients prefer for their care.

However, for a pragmatic trial an inpatient hospitalization (acute care, observation, or emergency department) still may be the most appropriate outcome measurement.

Pragmatic Trial Outcomes

There are many factors to consider when choosing what outcomes to measure and how to measure them, including feasibility, interference with practice, and the validity and precision of specific measures (Welsing et al. 2017). Because pragmatic trials focus on problems that are directly relevant to patients and clinician decision-making, the choice regarding outcome should be made with stakeholder preferences and requirements in mind (Welsing et al. 2017). There also are specific considerations related to inpatient events, such as:

  • What is the concept of interest?
  • What data are needed to answer the research question?  What data elements are needed to classify or decide about an event?
  • What is routinely measured for the anticipated study population? Are the data commonly documented with consistency during routine care? When and how are the data captured? Does the source provide those data with the right level of specificity and timing?
  • What is the quality of the data? Are the measures valid, accurate, and precise?
  • What opportunities are available to measure the accuracy of the data?
  • What other data sources can be combined to make the data more reliable?
  • Can an inpatient event be attributed to a specific cause? How? What confirming data are needed? Can manual review be avoided?
  • Are there cases that do not present to the facility?
  • How will you capture inpatient events that occur in health systems not participating in the trial?
  • Are there effect modifiers (such as age, socioeconomic status, ethnicity, type of medical practice, comorbidity, concomitant medication, and treatment adherence) that will change the treatment effect? (Welsing et al. 2017)

After some initial decisions are made, an investigator will need to consider how to collect the data with as little burden and disruption to the health care system’s workflow as possible (Larson et al. 2015).

Key questions to be considered include:

  • Will the act of measuring change clinical practice or the generalizability of the study’s results?
  • Do different local practices and workflow result in different interpretations of the same data? How might data availability and interpretation differ by facility, unit or provider?
  • Are the documentation procedures consistent across facilities, units, and providers?
  • Are there monetary or time costs associated?
  • If, after considering these questions, it does not seem practicable to measure the selected outcome, an investigator may need to reconsider what to measure.

Case Studies

In this section, we use case studies to illustrate some of the challenges faced in pragmatic trials that use inpatient events as endpoints.

1. ICD-Pieces: Understanding how re-imbursements affect outcomes measurement

As described earlier in this section, Medicare defines stays in the hospital as either inpatient, outpatient, emergency department, or observation stays.

Medicare Part A pays for inpatient care at a hospital. In 2025, before Medicare starts covering the first 60 days of an inpatient hospital stay (in a single benefit period), a beneficiary must pay a deductible of $1,676.

Medicare Part B pays for outpatient care or care received under observation status. Under Medicare Part B, after paying the annual deductible of $257 (in 2025), a typical patient pays 20% of the Medicare-approved amount for most outpatient and observation-status services under original Medicare (Medicare Interactive 2026).

To reduce costs, in 2016, Medicare updated the rule regarding when inpatient admissions are appropriate for payment under Medicare Part A:

Two-Midnight rule: “Under the Two-Midnight Rule, inpatient admissions are generally payable under Medicare Part A when the admitting physician reasonably expects the patient to require hospital care spanning at least two midnights, and the medical record supports that expectation. A case-by-case exception may also apply for shorter stays when the clinical circumstances warrant inpatient care (Centers for Medicare & Medicaid Services, 2023).”  Note that Medicare considers observation care an outpatient service, even if that patient stays overnight in the hospital. In addition, Medicare pays for nursing home care only if a patient spends at least three consecutive days in the hospital as an admitted patient, and observation care doesn’t count on that clock (Medicare Interactive 2019).

This Two Midnight rule differs from definitions currently used by clinical researchers and should be considered when investigators are designing a pragmatic clinical trial. For example, the Improving Chronic Disease Management with Pieces (ICD-Pieces) trial was designed to determine if clinical decision support tools (PIECES) used by practice facilitators can improve the outcomes of patients with chronic kidney disease (CKD), diabetes, and hypertension. The primary outcome is the one-year hospitalization rate (unanticipated hospitalization based on the hospital wide readmission standard from CMS; see definition below). Secondary outcomes include ED visits, readmissions, CV events and death. About two years into the trial, the two-midnight rule was implemented.  The original planned primary outcome was unanticipated hospitalization based on the hospital-wide re-admission standard from CMS. Early on in the planning year (the UH2 phase), because of implementation of a new criteria for a “2 midnight rule,” some hospital systems were shifting admissions into observation status (Vazquez and Oliver 2019).

Because of this change in criteria, the investigators defined an un-anticipated hospitalization as both an observational stay and the unplanned hospitalization stay (Vazquez and Oliver 2019). The ICD-pieces team was able to modify their definition of hospitalization as an endpoint to make it more accurately reflect actual care (Vazquez and Oliver 2019).

CMS defines a hospital re-admission as occurring for Medicare beneficiaries who have a readmission for any cause, except for certain planned readmissions, within 30 days from the date of discharge after an eligible index admission. If a beneficiary has more than one unplanned admission (for any reason) within 30 days after discharge from the index admission, only one is counted as a readmission (Centers for Medicare and Medicaid Services 2016).

CMS guidance for reporting outcomes has gone from just hospitalization and re-admission to a new standard: excess days in acute care. In response, health systems have kept patients in observation care or emergency departments. This is important because Medicare’s hospitalization definition may differ from that used in clinical practice.

  • Part A (hospital insurance) pays for care received at the hospital by an inpatient.
  • Part B (medical insurance) pays for care received at the hospital by an outpatient under observation status.
  • Part C (Medicare Advantage) includes both Parts A and B but is provided by private insurance companies.

2. TRANSFORM-HF

The ToRsemide compArisoN with furoSemide FOR Management of Heart Failure (TRANSFORM-HF) trial (ClinicalTrials.gov Identifier: NCT03296813) was an individually randomized PCT for patients hospitalized for new or worsening heart failure (Greene et al. 2021). Prior to hospital discharge, patients received a prescription for one of two commonly prescribed oral diuretics (torsemide or furosemide). All-cause mortality (see Using Death as an Endpoint) and re-hospitalization over 12 months were endpoints.

A re-hospitalization event was defined as either: (1) “an admission to an inpatient unit or a visit to an emergency department that resulted in at least a 24-hour stay (or a change in calendar date if the time of admission/discharge was not available) or (2) an inpatient admission reported by the patient/proxy with an admission date after discharge from the index hospitalization. This definition excluded observational stays of less than 24 hours. The type and reason for the admission were not factored into the TRANSFORM-HF statistical analysis plan's definition of an event.

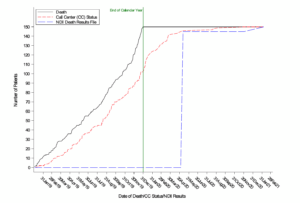
Re-hospitalization events could be triggered via telephone interviews at 1, 6, and 12 months with the patient or proxy, through official medical records obtained when neither the patient nor any of their proxies could be reached, or through discharge summaries from a 12-month medical record query that screened for hospitalizations 12 months after randomization at the patient’s hospital/site (Figure; TRANSFORM HF Statistical Analysis Plan). If an event was triggered, then the event was recorded in the database along with the date and time of admission and discharge.

Figure. TRANSFORM-HF Hospitalization Events

It is worth noting the process for identifying hospitalizations that occurred in health systems other than the systems participating in the trial: if at one of the follow-up calls a patient or proxy indicated that a hospitalization occurred, the study staff requested a discharge summary from sites that were not participating in the trial.

3. Case Example: ADAPTABLE

The Aspirin Dosing: A Patient-Centric Trial Assessing Benefits and Long-term Effectiveness (ADAPTABLE) study was a large, pragmatic trial designed to determine the optimal maintenance aspirin dose for patients with coronary artery disease. According to the protocol, the primary endpoint of this study was the composite rate of all-cause mortality, hospitalization for nonfatal MI, or hospitalization for nonfatal stroke (National Patient-Centered Clinical Research Network (PCORnet) 2015). The sites participating in ADAPTABLE were part of PCORnet, and have agreed to format their data according to a common data model (CDM). Algorithms were validated for extracting endpoint data from the EHR through the CDM, from Medicare claims data, and from select private health plan data (Marquis-Gravel et al. 2021). For more on longitudinal data linkage in ADAPTABLE, see this Case Study. ADAPTABLE enrolled around 15,072 participants (Jones et al. 2021) referred by their physician, and enrolled through an online portal. As a part of this process, they are asked to report any hospitalizations through the portal.

The reconciliation of these patient-reported hospitalizations is shown in the figure below.


From the ADAPTABLE Protocol. Used with permission.

The ADAPTABLE investigators researched patient-reported health data and meta-data standards for patient-reported outcome (PRO) data. They found no useful standardized concepts for hospitalization for nonfatal myocardial infarction (MI) or stroke and state “We do not believe there is much to be gained for the purposes of this study by combining existing atomic concepts to represent these more complex items” (Yang and Tenenbaum 2018).


SECTIONS

CHAPTER SECTIONS

REFERENCES

back to top

Allen LA, Hernandez AF, O'Connor CM, Felker GM. End points for clinical trials in acute heart failure syndromes. J Am Coll Cardiol. 2009;53(24):2248-2258. doi:10.1016/j.jacc.2008.12.079. PMID: 19520247.

Califf RM, Sugarman J. 2015. Exploring the ethical and regulatory issues in pragmatic clinical trials. Clin Trials. 12:436-441. doi:10.1177/1740774515598334. PMID: 26374676.

Centers for Medicare and Medicaid Services. 2015. Fact sheet: Two-Midnight Rule. https://www.cms.gov/newsroom/fact-sheets/fact-sheet-two-midnight-rule-0

Centers for Medicare and Medicaid Services. 2016. Hospital-Wide All-Cause Unplanned Readmission Measure (NQF #1789). https://innovation.cms.gov/files/fact-sheet/bpciadvanced-fs-nqf1789.pdf

Centers for Medicare & Medicaid Services. 2023. Medicare program: Hospital inpatient prospective payment systems for acute care hospitals and the long-term care hospital prospective payment system and policy changes and fiscal year 2024 rates; Quality reporting and Medicare and Medicaid promoting interoperability programs requirements for eligible hospitals and critical access hospitals; Costs reporting and provider enrollment policies; and physician-owned hospitals. Federal Register, 88(174), 58640–59254. https://www.federalregister.gov/d/2023-18695

Chin CT, Wang TY, Anstrom KJ, et al. 2011. Treatment with adenosine diphosphate receptor inhibitors-longitudinal assessment of treatment patterns and events after acute coronary syndrome (TRANSLATE-ACS) study design: expanding the paradigm of longitudinal observational research. Am Heart J. 162:844–851. doi:10.1016/j.ahj.2011.08.021. PMID: 22093200.

Greene SJ, Velazquez EJ, Anstrom KJ, et al. 2021. Pragmatic design of randomized clinical trials for heart failure. JACC: Heart Failure. 9:325–335. doi:10.1016/j.jchf.2021.01.013. PMID: 33714745.

Hicks KA, Mahaffey KW, Mehran R, et al. 2018. 2017 Cardiovascular and stroke endpoint definitions for clinical trials. Circ. 137:961-972. doi:10.1161/CIRCULATIONAHA.117.033502. PMID: 29483172.

Jones WS, Mulder H, Wruck LM, et al. 2021. Comparative effectiveness of aspirin dosing in cardiovascular disease. N Engl J Med. 384:1981-1990. doi:10.1056/NEJMoa2102137. PMID: 33999548.

Larson EB, Tachibana C, Thompson E, et al. 2015 Jul. Trials without tribulations: minimizing the burden of pragmatic research on healthcare systems. Healthcare. doi:10.1016/j.hjdsi.2015.07.005. PMID: 27637816.

Medicare Interactive. Medicare Interactive. https://www.medicareinteractive.org/. Accessed March 2, 2026.

Marquis-Gravel G, Hammill BG, Mulder H, et al. 2021. Validation of cardiovascular end points ascertainment leveraging multisource electronic health records harmonized into a common data model in the ADAPTABLE randomized clinical trial. Circ Cardiovasc Qual  Outcomes. 14:e008190. doi:10.1161/CIRCOUTCOMES.121.008190. PMID: 34886680.

National Patient-Centered Clinical Research Network (PCORnet). 2015. Aspirin Dosing: A Patient-Centric Trial Assessing Benefits and Long-term Effectiveness (ADAPTABLE) Study Protocol.

Perkins DO, Wyatt RJ, Bartko JJ. 2000. Penny-wise and pound-foolish: the impact of measurement error on sample size requirements in clinical trials. Biol Psychiatry. 47:762–766.

U.S. Department of Health and Human Services. 2018. Clinical Trial Endpoints for the Approval of Cancer Drugs and Biologics Guidance for Industry. https://www.fda.gov/regulatory-information/search-fda-guidance-documents/clinical-trial-endpoints-approval-cancer-drugs-and-biologics

US Food and Drug Administration. 2018. Framework for FDA’s real-world evidence program. https://www.fda.gov/media/120060/download.

Vazquez MA, Oliver G. 2019. ICD-Pieces: Lessons Learned in an Ongoing Trial. https://dcricollab.dcri.duke.edu/sites/NIHKR/KR/GR-Slides-03-29-19.pdf

Welsing PM, Oude Rengerink K, Collier S, et al. 2017. Series: pragmatic trials and real world evidence: Paper 6. Outcome measures in the real world. J Clin Epidemiol. 90:99-107. doi:10.1016/j.jclinepi.2016.12.022. PMID: 28502810.

Yang Z, Tenenbaum J. 2018. ADAPTABLE Supplement Report: Patient-Reported Health Data and Metadata Standards in the ADAPTABLE Study. https://dcricollab.dcri.duke.edu/sites/NIHKR/KR/ADAPTABLE%20Supplement%20Patient-Reported%20Health%20Data%20Standards-2018-07-19.pdf


Version History

March 2, 2026: Updated as part of annual review (changes made by K. Staman).

September 30, 2022: Updated references. Updated text, mainly to convey past tense (changes made by K. Staman and L. Stewart)

January 18, 2021: Moved sections from here to both the “Acquiring Real-World Data” chapter and the “Assessing Fitness for Use” chapter. References were updated at this time (changes made by K. Staman).

July 2, 2020: Minor corrections to layout and formatting (changes made by D. Seils).

Published June 29, 2019.

Using Death as an Endpoint

Choosing and Specifying Endpoints and Outcomes


Section 5

Using Death as an Endpoint

Prevention of death through therapeutic intervention is often a major focus of clinical research. At the individual patient level, death is the hardest of the "hard" or objectively measurable endpoints. In traditional explanatory trials, patient deaths are identified by site personnel, and the study's clinical events committee adjudicates types of death. However, death identification and adjudication may be more complicated with pragmatic clinical trials (PCTs) that rely on data collected from the patient's electronic health record (EHR), medical claims, self-report, or medical devices. Ascertaining if and how a patient death has occurred is considerably more complicated, especially if a patient dies outside the clinical care system (Eisenstein et al. 2019).

Since the typical United States healthcare system does not have standardized processes to ascertain patient deaths, explanatory clinical trials frequently include significant resources dedicated to collecting death data; a study coordinator may contact a family member or other proxy to schedule a study visit, or may search the internet to determine the patient's current location (Eisenstein et al. 2019). Compounding the issue, there is no timely and comprehensive national death database that efficiently links with EHR records (Eisenstein et al. 2019). This is due to differences between the types of information EHRs collect, what death databases require for linking, and state restrictions on the reuse of death data and other vital records (da Graca et al. 2013). However, for PCTs that use death as an endpoint, there are alternate procedures for obtaining death data. In this section, we describe alternative death data sources and methods for obtaining information from them. We then illustrate the use of these procedures in a hybrid death identification and verification approach that is being used in the ToRsemide compArisoN with furoSemide FOR Management of Heart Failure (TRANSFORM-HF) PCT (ClinicalTrials.gov Identifier: NCT03296813).

Sources of Death Data

Obtaining information to determine whether someone is alive or dead would seem to be a simple task. However, the reported mortality rate for a group of individuals can vary widely depending upon the death information source used and the method for ascertainment (Warren et al. 2017). As a first step in death-event identification planning, researchers should determine what data they require from the death event. This will determine the most appropriate death data source for their study, as sources of death data vary in both the amount and type of data they provide. For example, it may be sufficient to simply know the study participant has died, otherwise known as the “fact of death” (FOD) information about that decedent. This often involves a non-comprehensive death file with enough data elements to link with to determine the date of death. However, some studies will want the date of death, cause of death, and other related conditions, and perhaps occupation and educational level.

Next, researchers should consider whether a single death information source is sufficient for their needs or whether a hybrid approach that combines multiple data sources might yield better results. Factors to consider include whether one source makes the most sense for a specific study, and if multiple sources are combined, how will death discrepancies between data sources be addressed? While researchers can reason about the appropriateness of specific death information sources for a particular study, there is scant empirical data to use in making those determinations. Three national databases that should be considered are the Death Master File from the Social Security Administration (SSA), the Medicare Master Beneficiary Summary File, and the National Death Index (NDI) from the National Center for Health Statistics (NCHS). Artificial intelligence (AI), including machine learning, natural-language processing, and record-linkage techniques can supplement these sources by improving matching between clinical records and national death files, or extracting cause-of-death from unstructured data (Al-Gradi et al. 2025; Young et al. 2021). Other sources of death information are individual state vital statistics and the use of a central call center that consolidates site follow-up activities typically conducted in explanatory clinical trials. An additional recent source to consider is not a database but rather an FOD web service provided through the nonprofit National Association of Statistics and Information Systems (NAPHSIS).

The Federal-State Relationship in Collecting Vital Records

A brief overview of the process that produces vital event data and statistics is a useful introduction to explaining the nuances of who “owns” the data and why it is so challenging to have a single, timely, and complete national file available for adjudication of vital status.

The United States has always had a highly decentralized federal vital statistics system. Collection of vital statistics in the United States is a state function rather than a federal function. The reason is due both to how vital record collection evolved, and also to the legal situation: because the collection of these data is not explicitly outlined as a federal responsibility in the Constitution, federal authority in directly conducting this process is limited. On a practical level, the local nature of vital event registration is most likely due to its origins as a local government function and because it would have been impossible to undertake the process efficiently at a federal level until the advent of modern technologies. The civil registration of births, deaths, and marriages is one of the oldest systematic collections of data in the United States. Births, deaths, and marriages were a civil registration function in the Commonwealth of Virginia as early as 1632. The modern era of systematic registration of vital events began in 1842 in Massachusetts with passage of the first law requiring statewide registration of vital events. Since 1933, all states and territories have required registration of vital events. Since then, the registration of vital events has broadened to include not only civil registration but also the collection of public health data. More recently, vital records offices have the added responsibility of helping to ensure national security through the effective stewardship of birth certificates (National Research Council 2009).

Today, vital event data reported to the federal government includes data on birth, death, and fetal death events. Although local vital record offices also collect data on marriages and divorce, the federal government stopped routine collection of this information in 1995. The NCHS is charged with collecting and aggregating these data at the federal level. Since vital event registration happens at a local level, the NCHS obtains data from local registrations through the Vital Statistics Cooperative Program (VSCP), which pays each state/territory for its data. Each jurisdiction has a VSCP agreement with NCHS to provide data according to NCHS national standards for quality and timeliness (National Research Council 2009).

There are a number of challenges with national aggregation of vital statistics. One of these is timeliness. Vital statistics compiled centrally at the national level can only be as timely as the latest state. Many states have implemented electronic systems but not fully. As of June 2018, NAPHSIS reported 46 jurisdictions with an electronic death registration system (EDRS), but only 39 had over 75% of the death events registered through an EDRS. Another limitation is the need to ensure state laws governing the release of vital records are honored by federal agencies that receive these data. The redaction from the death master file, explained in more detail below, is the result of this legal constraint. Another challenge is ensuring a high degree of data quality in a process that involves 57 separate jurisdictions, with those using electronic data capture systems rarely using the same system. The public health aspects of data collection are perhaps the most challenging as they often involve a clinical provider. The vast majority of clinical providers use EHRs today. Yet, integration between EHRs and electronic vital record systems is rare. A handful of states have enabled integration of an EHR with their EBRS. As of June 2018, only two states (California and Utah) had demonstrated an integration between their EDRS and an EHR. The California experience showed relatively high implementation costs for health systems (>$50,000 to start), which could be a significant barrier to broader adoption. Furthermore, when it comes to deriving the important “cause of death,” the process is not immediate, and in 25% of the cases requires a manual review and adjudication by a trained nosologist. There is only one cause of death for the decedent. Think of it as "classifying" the death into only one cause, or assigning it a single code from the International Classification of Diseases (ICD). In order to accomplish this, the model death certificate in the United States has four blocks of narrative text known as the “underlying causes of death.” The medical certifier uses these to outline the cascade, or sequence, of events that resulted in the death. The NCHS uses a semi-automated process to classify the single "cause of death" in the NDI database based on the information on the death certificate. The national file that includes cause of death is not complete until all the deaths have been classified for the reporting time period, typically a calendar year.

Death Master File

To administer its programs, the Social Security Administration (SSA) collects death information from family members, funeral homes, financial institutions, postal authorities, states, and federal agencies. Prior to 2011, the SSA Death Master File (DMF) was the timeliest, most comprehensive, and least expensive method for obtaining patient death data (da Graca et al. 2013). However, in 2011, the SSA agreed with closed record, stating that §205(r) of the Social Security Act (SSA 1983) could not supersede state laws limiting disclosure of the state records. This resulted in the removal of 4 million records (5%) and in the annual exclusion of 1 million new files (40% of new deaths) from the DMF (National Technical Information Service 2011; da Graca et al. 2013). While the public DMF does not contain death data received from states, it still includes information obtained from other sources and remains a valuable death data resource for researchers. Potential users can apply to the certification program and pay an annual subscription fee for access to the files. Alternatively, DMF data are commercially available, in whole or in part, in services such as Ancestry.com and Legacy.com. When using the DMF, researchers should be aware that these death records are incomplete. A recent analysis compared the DMF to Medicare and commercial insurance databases and demonstrated that the DMF markedly underestimated mortality rates (Navar et al. 2019). This under-capture of death data varied significantly overtime and between states, leading the authors to conclude that “Researchers should avoid relying on mortality estimates based on the SSDMF alone and be aware of heterogeneity in SSDMF data completeness” (Navar et al. JAMA Cardiology 2019). The implication is that while DMF deaths are actual deaths, the absence of a DMF death does not mean that a patient is alive.

Medicare Master Beneficiary Summary File

If a substantial number of study patients are Medicare beneficiaries, the Medicare Master Beneficiary Summary File may be an option for obtaining death data. This file includes death information received from Medicare claims, family member online date of death edits, and Medicare benefits information collected from the Railroad Retirement Board and the SSA. This file is available from the Research Data Assistance Center (ResDAC) with a 9-month lag from the close of the calendar year (da Graca et al. 2013). The standard linking approach relies on direct identifiers—Social Security /Health Insurance Claims number (Medicare ID number), date of birth, and sex. In the past, ResDAC also has allowed the use of deterministic linkage approaches based on dates of service (Hammill et al. 2009). Researchers should be aware that Medicare Master Beneficiary Summary File death records only include people with a Medicare beneficiary number. This means that the absence of a death in this file does not mean that a non-Medicare patient is alive.

State Vital Statistics

Only states have the authority to collect birth and death data, and they typically collect this information through vital records offices within departments of public health. The process of registering the death event has both legal and epidemiological components and involves at least six separate sources of information, making it a complex process often not well understood outside the confines of the small public health vital statistics community. Coroner cases are more complex and involve additional sources of information including a coroner (law enforcement) and a forensic pathologist. Some states, like California, have made the vital statistic process entirely digital and accept applications for public use birth and death files. California has two types of death files available. The Comprehensive Death File requires review and approval by the California Vital Statistics Advisory Committee (VSAC) and includes a substantial amount of data, including cause of death, Social Security number, etc. The California non-comprehensive death file is an FOD file and includes deaths from 2005 to present. The death data has a short lag time (85% of deaths are less than 30 days old when included in the file, 96% of deaths are less than 60 days old). The cost is minimal ($400 per year). California does not include a Social Security number in the non-comprehensive death file, as the statute regarding public release of death information prohibits it. Depending on the number and location of sites in a clinical trial, the use of state vital statistics, alone or in combination with another death data source, may be a viable option for obtaining death endpoint data. However, information from more than one state may be necessary to detect the death of a patient who resided in one state and died in another. Researchers should be aware that state vital statistics death records are incomplete and only contain information for deaths occurring in that state. This means that the absence of a death in a state death file does not mean that a patient is alive.

NAPHSIS EVVE Fact of Death (FOD) Service

The NAPHSIS FOD service is not a database but instead a secure online web service derived from a service originally developed to verify birth certificates. Birth certificates are often required to be presented for benefit eligibility, and origination of key identification documents (driver’s licenses, Social Security cards, passports, etc.). NAPHSIS electronic verification of vital events (EVVE) allows a state agency office in one state to verify a birth certificate being presented by the applicant from another state. NAPHSIS extended this service to provide fact of death querying based on death certificate data from participating states. A key aspect of the NAPHSIS EVVE system is that it is a distributed querying system that directly accesses vital records databases of participating states on demand, so it is using the most current information for each state. The SSA DMF, Medicare Master Beneficiary Summary File, and the Centers for Disease Control and Prevention's NDI have varying degrees of latency, or “lateness,” because they must aggregate data from all the states into a single centralized system, which can make the databases anywhere from 6 to 36 months behind when the death events occurred. State files like the California non-comprehensive file are timelier but still have a lag time of around 15 to 30 days. Although the NAPHSIS EVVE FOD does not have the 6- to 36-month aggregation time lag, not all states participate. As of 2025, 44 of 57 jurisdictions were part of the EVVE FOD. Pricing from 2018 for nongovernmental use varies and is based on volume. For example, submitting 5000 to 10,000 records to the service costs $3000, or $1.60 per record. A query with 1 million records costs $10,000, or $0.01 per record. It is important to note that although this is the timeliest source of death data, it is only fact of death information, and some states (including California) do not participate.

National Death Index

The Centers for Disease Control and Prevention’s NCHS contracts with state vital statistics offices to receive and compile annual death registries in the NDI, a centralized database of all US deaths. The mission of NCHS is to help guide public health and health policy decisions and to “aid health and medical investigators with their mortality ascertainment activities” (NCHS). This service does not allow access to the public or organizations for legal, administrative, or genealogy purposes. The NCHS only allows use of the NDI for mortality determination in qualifying research studies. Use for administrative purposes is not allowed. This is not the result of statutory restriction, but rather because of how the NDI has evolved. The NDI is not provisioned by law nor is it funded through Congressional appropriation. Instead, the NDI is the result of over 40 years of trust building between the 57 federal jurisdictions and the NCHS (Dr. Charles Rothwell, personal communication). The agreed-upon process and use has been acceptable to all 57 jurisdictions under the existing research-only use model, which is also an accepted use in every jurisdiction. NCHS is, in essence, an “honest broker,” trusted by the 57 jurisdictions to use their data to support research studies in any jurisdiction. This is key in ensuring the NDI has all the deaths nationally and is a complete data set. Broadening the use of the NDI beyond the research-only scope would invariably bring it into conflict with states that have restrictive laws on the use of these data, thus leading to redactions and an incomplete data set. What has been acceptable to all 57 jurisdictions has been tightly controlled use for research vital status adjudication. The NDI service is self-supporting through fees, which have portions of revenue allocated back to the state/territory jurisdictions that provision the data. Unlike the other death data sources listed above, the NDI is a complete death data set. All jurisdictions report all deaths to the NCHS, which makes the NDI the most complete death data set available in the United States today. The implication is that NDI deaths are actual deaths and the absence of an NDI death means that a patient can be considered alive at the end of the reporting year. This distinction becomes important when determining a study subject’s last known status (ie, dead or alive).

NDI Cause of Death

NDI Plus reports patient cause of death using death certificate information. However, this information is not always reliable (Lauer et al. 1999). Death determination can be inexact due to low patient autopsy rates and complex medical conditions. Physicians typically receive no training in completing death certificates and often confuse the mechanism of death (e.g., cardiac arrest) with the underlying cause of death (e.g., cancer). Lloyd-Jones and colleagues compared cause of death information from death certificates with that adjudicated by a panel of three physicians (Lloyd-Jones et al. 1998). These researchers found that coronary heart disease as the cause of death was 24% greater on death certificates versus physician panel adjudications. They also found that this error rate increases with patient age.

Using the NDI

To gain access to the NDI, potential users submit an application form along with a current Institutional Review Board (IRB) approval document. There is an approximate 2- to 3-month review period. Once the application is approved, investigators are not granted direct access to the database but rather submit study subject records in a standard text file (flat file) format, using NDI’s coding specifications, on a password-protected CD-ROM or through their secure File Transfer Protocol (sFTP) site. The investigator will receive a password-protected CD-ROM or staff will return the information through the sFTP with potential death matches for the investigator to verify.

Beginning January 1, 2020, the NIH will reimburse the National Center for Health Statistics (NCHS) National Death Index (NDI) for the cost of NIH-supported investigators linking their research databases to the NDH. To be covered by this agreement, the NIH-supported researcher must be the owner or steward of the data being linked to the NDI datafile. Investigators are limited to four linkage requests per calendar year, and linkage requests exceeding $100,000 require pre-approval by the NIH. NCHS will be implementing an improved online application and will increase the frequency of NDI releases to quarterly. NDI permits full deidentified research datasets with NDI-linkage to be shared without further NDI approval. Datasets with potentially re-identifiable data may also be shared if the dataset is not transferred from one owner to another.

The fees for using the NDI as of October 2025 were as follows:

  • $350 for the first search and $100 for each subsequent search
  • Routine search is $0.15 per unique patient per year being searched
  • NDI Plus search (which adds cause of death) is $0.21 per unique patient per year being searched
  • Known death search is $5 per patient regardless of how many years searched

NCHS provides a worksheet for calculating charges. Depending on the number of patients enrolled in a trial (many PCTs enroll tens of thousands of patients) and the number of years for follow-up, use of the NDI can be expensive.

Sample Worksheet for NDI Fees

Source: Screen shot from the worksheet for calculating National Death Index Charges. Available at: https://www.cdc.gov/nchs/data/ndi/ndi_user_fees_worksheet.pdf

Time Lag for NDI Data

Deaths are submitted electronically by states to NCHS throughout the calendar year. Death records are added to the NDI database (in a batch) after the end of each calendar year. An early release file is made available for both NDI Routine and NDI Plus searches when approximately 90% of the (previous) year's death records have been received and processed. NDI data releases can be delayed (e.g., COVID pandemic), but are typically available for investigator search requests in late January or early February and are considered preliminary. Additional deaths can still be added, and demographic variables (such as age) are subject to change. At the time of this file’s internal release, the NCHS also provides a summary table showing the completion rate by state so that studies can decide whether they should use the preliminary search. Note that although the CDC uses the nomenclature “early release” and “final file,” these files are not available for downloading, they are available for matching the records of submitted files using the application process described in the "Using the NDI" section.

NDI Early Release File – Vital Status Reporting Completion Status Sample Summary Table.

Note: The second column reflects cause of death data, which are included in an NDI Plus search. (Full table available at https://www.cdc.gov/nchs/ndi/completion_status.htm. Screen shot taken October 31, 2025.)

The final file reflects “all” of the (previous) year’s death records. This file is available in late October or early November. Once the final file for a given year is available, users of the early release file can submit the same records for one free rerun search, provided that all parameters are identical to the original early release search and submitted within 6 months of notification that the final file is available. The final file is static and won’t be modified unless there was a serious error; for example, about 125 records from Tennessee and Massachusetts were modified in the 2014 death final file. The cause of death was changed from “unspecified external” cause of death to either “suicide” or “homicide.” In this example, studies were allowed to resubmit their “true matches” from 2014 to obtain the corrected cause of death at no cost.

Is Final Really Final?

Belated records do exist. For example, a death in 2014 deemed a suicide may be disputed by family members and therefore not released to the NCHS for inclusion in the NDI until 2016.

However, the 2014 Final Death File would not be modified to include that death. Instead, it would show up in the 2016 file (released in 2017) with a date of death in 2014. Bottom line: once a year’s death records have been searched in the final file, there is no need to repeat that year in future searches unless in rare cases of modification where the investigator would be notified by NCHS.

See Appendix for the NDI death identification and adjudication process.

Data Elements

Death data sources use different data elements for matching. This means that investigators need to ensure that adequate matching information and required patient consents are obtained during the course of the trial. For example, in the TRANSFORM-HF case example described below, the investigators used the NDI that requires more detailed Asian race categories than typically are reported for clinical trials. These investigators also decided to obtain data elements that are not required but increase the likelihood of an NDI match. These include patient marital status (using NDI categories), patient social security number, and patient middle initial. The table below compares the types of information used in searching different death data sources. Researchers should be advised that some of these data elements are optional for specific data sources and that the specific coding for data elements may differ between data sources. For this reason, researchers should consult the instructions for each data source when planning data collection for their study.

Comparison of Data Elements Used for Matching
Data element Death Master File National Death Index Medicare Master Beneficiary File California’s non-comprehensive death file NAPHSIS EVVE FOD
Social security number x x x x
Beneficiary identification code x
First name x x x x
Middle name x x x
Middle initial x
Last name x x x x
Birth date x x x x x
Month of birth x
Day of birth x
Year of birth x
Death date x x x x
Last known zip code x
Sex x x x
Father’s surname x x
State of birth x
Place of birth x
Race x
County code
State of residence x
State of death x
Place of death (county or state/county) x
Marital status x

*Medicare Beneficiary ID (insurance ID) can also be used for matching.

Call Centers and Research Staff

Some studies use a central call center that consolidates follow-up activities typically performed by study sites. Call centers will perform telephone interviews with patients or their proxies at regular intervals using standard procedures that enhance overall study data quality and completeness. Research staff in the call center also may perform internet searches, visit ancestry.com and other social medial sources, search for obituaries and grave markers, and contact the patient’s health care providers for patient death information.

Comparison of Sources of Death Data for use in PCTs

The table below compares different death information sources.

Comparison of Sources for Death Data
Death Master File National Death Index Medicare Master Beneficiary Summary File  California Non-comprehensive Call Center 
Creator Social Security Administration Centers for Disease Control and Prevention National Center for Health Statistics Centers for Medicare and Medicaid California Department of Public Health Coordinating Center
Source data Primarily from family members of the deceased when a claim is made by a beneficiary but also by funeral homes, financial institutions, and the states Family members and funeral homes report deaths to the state. The states have monetary contracts to provide death registries annually to the NDI Death information received from Medicare claims, family member online date of death edits, and Medicare benefits information* Death certificates A proxy, grave marker, ancestry.com, legacy.com, online searches, social media, obituaries, medical records, enrolling site report


Cost Subscribers pay annual fee Per record/subscription. Can be expensive Variable. See fee worksheet Relatively inexpensive ($120/year) Cost of call center
Lag 4-6 months Reporting occurs in batches at the end of a calendar. The early release file (90% accurate) is generally available in February and the final file is available by the end of the calendar year. 9 months from the close of the calendar year 60 days for 96% of deaths Depends on call/follow-up schedule defined in the protocol
Cause of death No Included in an NDI plus search No No No
Data acquisition Researchers can run their own queries Data on patients must be submitted and a file will be returned ResDAC.com is a CMS-funded resource that helps researchers request data. An FOD file includes deaths from 2005 to present
Considerations In 2011, SSA stopped reporting 40% of deaths due to HIPAA regulations (National Technical Information Service 2011; da Graca et al. 2013). 1. Because deaths are included at the end of the calendar year, if a patient dies in January, and a researcher waits for the final file, it could involve almost a 2-year lag. 2. Depending on how many patients are involved in a trial and the follow-up duration, this method can be prohibitively expensive. File only includes information on Medicare beneficiaries Depending on the number of states involved in the trial, collecting the data from every state can be time consuming Involves extra effort and cost

*Note: This benefit information is in large part “collected from the Railroad Retirement Board (RRB) and the Social Security Administration (SSA)” (RESDAC 2018)

While the NDI will eventually report complete death data, there are reasons why a PCT may consider a hybrid approach that combines a call center with NDI searching. As an example, if a PCT participant dies in January, it potentially will be a year and a month before their death data are available in the early release file and almost two years before the data are available in the final file. If a participant dies in December, the lag to the early release file is only a month or two. This time lag can create problems for studies that rely upon NDI data and have reached the end of their follow-up period. Either they can wait until NDI reports all potential deaths for their study or they can supplement NDI with other death data sources. As an example, assume a clinical trial contacts study subjects at six-month intervals for telephone interviews. If a patient enrolls in January 2017 and the trial ends follow-up in February 2018, the NDI early release file for February 2018 deaths will not be available until early 2019 and the final file will not be available until October-November 2019; whereas death information derived from a 6- month follow-up telephone call to relative or friend will be available in August 2018. In contrast, if the patient enrolls in October 2017 and the trial ends follow-up in February 2018, the NDI early release file for a November 2017 death will be available in early 2018 and the final file in October-November 2018. In this case, a death identified in the NDI’s early release file will be available before the patient’s next scheduled telephone interview in April 2019. Due to time lags in death information availability, investigators may choose a hybrid approach that relies upon multiple death data sources. This hybrid approach may be particularly useful in an event-driven trial that ends follow-up when a prespecified number of events have occurred.

Another reason for selecting a hybrid approach is that a study may not be able to collect all information required for an NDI match. As an example, SSN is a key NDI search term, and many patients will be hesitant to share their SSN with the research study team. While the NDI can be searched without SSNs, this may lower the likelihood of finding a match. Thus, while the NDI may contain the required patient death data, the study may not have all of the information required to find the NDI match. In these instances, having a second death data source will serve to fill gaps in NDI death data searches.

TRANSFORM-HF Case Study

Use of NDI and Call Center for Ascertaining a Death Endpoint

In the ToRsemide compArisoN with furoSemide FOR Management of Heart Failure (TRANSFORM-HF) PCT (ClinicalTrials.gov Identifier: NCT03296813), pragmatic trial investigators used both the NDI and a call center for ascertaining death as and endpoint. Details of death ascertainment in TRANSFORM-HF were previously published by the authors of this chapter (Eisensten et al. 2019), and we will briefly summarize the salient aspects here.

TRANSFORM-HF is a randomized, PCT of patients hospitalized for new or worsening heart failure. The trial involved ~50 sites, and patients were individually randomized to receive a prescription for an oral diuretic (torsemide or furosemide; both are commonly prescribed) prior to hospital discharge (Greene et al. 2021).

All-cause mortality was the primary endpoint for TRANSFORM-HF, and investigators anticipated more than 720 deaths. The DCRI Call Center conducted follow-up interviews with patients at 30 days, 6 months, 12 months, and at 6-month intervals to ascertain patient status. Because the information sources used by the call center may (ie, contacting a proxy, searching for obituary acceptable grave marker, requesting medical records related to death) may be incomplete, investigators also searched NDI for patient deaths. Either method can be used to verify a patient death (Figure).

Flow Diagram for Confirmation of a Death

From: Eisenstein et al. 2019. Used with permission.

The TRANSFORM-HF study investigators considered the following Key Questions in their use of death as an endpoint. We believe these questions can be applied to other clinical trials where sites will not be responsible for identifying subject deaths and clinical events committees will not determine cause of death.

  • Do we need just FOD or do we need other data such as cause of death, occupation, marital status, educational level, manner of death, etc. Could EVVE FOD be sufficient instead of using NDI?
    • TRANSFORM-HF’s primary endpoint was all cause mortality. Although the FOD endpoint was the simplest death endpoint to collect, TRANSFORM-HF also required date of death for the purpose of primary endpoint statistical analysis. The Data Safety Monitoring Board also asked for cause of death data (post COVID), which was obtained from the NDI.
    • If other death-related (e.g., cause or location) and non-death-related (e.g., occupation, marital status) are required, this will constrain the number of potential death data sources and may degrade the overall quality of information available to determine the death endpoint.
  • How often should we submit the NDI search?
    • TRANSFORM-HF’s NDI search plan was based upon the anticipated accrual of death events during the trial, and used both the early and final release files to capture death events at the earliest times they were available. TRANSFORM-HF was an event-driven trial designed to proceed until 721 patient deaths were recorded. Having early release files was helpful, as most study deaths were available shortly after the end of the calendar year.
    • Since NDI data are available for specific calendar years, trials typically will conduct at least one search per year. Because of the time involved in managing NDI searches, many trials may choose only to use each year’s final release file.
  • Should we search all patients or only when vital status is unknown?
    • TRANSFORM-HF’s NDI search plan included all patients not matching a previous NDI search. This means that a patient with death verified by the DCRI Call Center could be included in NDI searches. This was particularly helpful in determining dates of death, as proxies may know that a patient has died, but may not know the exact date of death. This also allowed for comparison between death data accrual from the NDI versus the call center. There was substantial agreement between deaths identified by a centralized call center and the NDI. However, the time between a death event and its identification is significantly less for the call center as shown in the Figure (Eisenstein, et al. 2022).

    • Other studies may choose to eliminate patients from NDI searches when they are identified by another death data source.
  • If we find a "true match" during a search, can we drop the subject from future searches?
    • TRANSFORM-HF’s NDI search plan stipulated that when patients were identified as a true NDI match, they were not included in subsequent years searched.
    • Since the NDI file is final for each year, there was no reason for a study to include matched patients in subsequent years searched.
  • We’re only doing follow-up phone calls for a maximum of 30 months post-randomization. Should we keep doing the NDI search on the early cohort of patients even if the death file being searched is beyond 30 months from their randomization date?
    • TRANSFORM-HF’s NDI search plan excluded patients from subsequent year searches who had reached their 30-month anniversary.
    • Other studies may choose to extend NDI searches beyond the follow-up period as a means of obtaining long-term mortality data for their patients. However, this use of NDI data should be noted in the protocol, informed consent, and other regulatory documents.
  • Similar question for the later cohorts with less follow-up time by the Call Center.
    • As stated above other studies may choose to extend NDI searches beyond their follow-up period. However, this use of NDI data should be noted in the protocol, informed consent, and other regulatory documents.
  • What about later cohorts with less follow-up time by the call center?
    • As stated above, other studies may choose to extend NDI searches beyond their follow-up period. However, this use of NDI data should be noted in the protocol, informed consent, and other regulatory documents.
  • What are the possible permutations of non-agreement between the Call Center and NDI results that we should account for?
    • Most instances of non-agreement will be timing related, with one death data source identifying a death event before the other. In the TRANSFORM-HF study, there was substantial agreement between deaths identified by a centralized call center and the NDI. However, the time between a death event and its identification was significantly less for the call center (Figure) (Eisenstein et al. 2022). Both the DCRI Call Center and the NDI were needed because they served different functions. The DCRI Call Center identified death events earlier and provided real-time data (death and other) for use in monitoring study progress. The NDI searches both confirmed call center–triggered deaths and identified additional deaths not identified by the call center. If NDI searches had been the sole death data source, this could have significantly delayed study results availability and the time when patients might have benefited from their dissemination (Eisenstein et al. 2022).
    • The TRANSFORM-HF’s statistical analysis plan considered both death event sources (DCRI Call Center and NDI search) as being equal. Hence, if either source identified a death event, it was accepted without verification by the other death data source.
    • In situations where both data sources have had sufficient time for death event identification, there were instances when either the NDI search or the call center identified a death and the other did not. These few instances were due to incomplete information for the NDI search or deficiencies in call center death data sources (Eisenstein et al. 2022).
    • Other studies will determine how to manage disagreements between different death data sources. This should occur before the study commences enrollment.
  • Can we assume if a patient wasn’t found dead by the call center or NDI that they are alive?
    • Positive contact by the call center can be used as evidence that the patient is alive as of the call date. However, if the call center does not verify the patient is dead, that does not mean the patient is still alive, only that the patient was alive on the last contact date.
    • In contrast, if the NDI search does not identify the patient as dying in a calendar year, that patient is presumed to be alive on the last day of the calendar year.
  • What will we consider the event-free censoring date for mortality given we have staggered amount of follow-up per “cohort,” call center and NDI methodology, etc.?
    • Although TRANSFORM-HF subjects did not have an “end of study visit” with the enrolling sites, they were scheduled to have a final telephone visit with the DCRI Call Center. Depending upon their entry cohort, this final visit occurred at 12, 18, 24, or 30 months. This date of the final visit, if it took place, was the subject’s censoring date.
    • Other studies will need to decide how to determine censoring dates for study subjects, and to consider statements made in the study protocol, as well as informed consent and other regulatory documents.

Appendix. NDI Death Identification and Adjudication Process

NDI Death identification process

  • Each submitted record must contain at least one of the following combinations of identifying data elements:
    • Social Security number, sex, full date of birth present
    • Last name, first initial, month of birth, year of birth present
    • Last name, first initial, Social Security number present
  • Additional demographic variables increase the odds of a true match:
    • Middle initial
    • Father’s surname
    • State of Birth
    • State of residence
    • Marital Status
    • Race

Death Adjudication Process

Search Results Score

  • Records are returned with a score reflecting the degree of agreement between the identifying information on the submission record and the NDI death record.
  • The score is based upon probabilistic weights assigned to each of the identifying data items used in the NHIS -NDI record match (Fellegi and Sunter 1969).
    Score = {ΣWSSN1 + …+ WSSN95} + Wfirstname x sex x birthyear + Wmiddleinitial x sex + Wlastname + Wrace + Wsex + Wmaritalstatus x sex x age + Wbirthdate + Wbirthmonth + Wbirthyear + Wstateofbirth +Wstateof residence

Class

  • Then, each match is categorized into one of five mutually exclusive classes that take into account which identifying items agree.
  • Classes reflect that some of the 12 NDI identifying items are more important for determining true matches than others (e.g., SSN versus state of birth) and that non-changing identifying information is more important than information that can change over time (e.g., birth surname versus marital status).
  • As SSN is a key identifier in the matching process, each NHIS-NDI record match is initially classified according to whether SSN is:
    • present and agrees (Class 1 or 2), or
    • present but disagrees (Class 5), or
    • missing (Class 3 or 4).
  • Class 1: Agrees on at least 8 (of 9) digits of SSN, first name, middle initial (including blank), last name, birth year (+/- 3 years), birth month, sex, and state of birth.
  • Class 2: Agrees on at least 7 (of 9) digits of SSN and at least 5 more of the following items: first name, middle initial (including blank), last name, birth year (+/- 3 years), birth month, sex, and state of birth.
  • Class 3: SSN unknown but eight or more of first name, middle initial, last name, father’s surname (for females), birth day, birth month, birth year, sex, race, marital status, or state of birth match.
  • Class 4: SSN is unknown on either the NHIS submission record or the NDI record and fewer than 8 of the items listed in Class 3 match.
  • Class 5: SSN is present but fewer than 7 (of 9) digits on SSN agree.

Algorithm for Determining True Matches

1.  Exclude poor matches:

–      If NDI death date is before the randomization date

–      If NDI score<=0

–      If NDI class=5

2.  Narrow down potential matches to best single match:

–      Drop duplicates (i.e., match records with same death certificate)

–      Select the one with the smallest value of class for the patient

–      Select the one with the largest score

–      Manual review in event of a tie (use importance of matching items as tiebreaker)

SECTIONS

CHAPTER SECTIONS

REFERENCES

back to top

Al-Garadi  M, LeNoue-Newton M, Matheny M, et al. 2025. Automated extraction of mortality information from publicly available records. J Med Internet Res. 27:e71113. doi: 10.2196/71113. PMID: 40824124.

da Graca B, Filardo G, Nicewander D. 2013. Consequences for healthcare quality and research of the exclusion of records from the Death Master File. Circ Cardiovasc Qual Outcomes. 6(1):124-128. doi:10.1161/CIRCOUTCOMES.112.968826. PMID: 23322808.

Greene SJ, Velazquez EJ, Anstrom KJ, et al. 2021. Pragmatic design of randomized clinical trials for heart failure. JACC: Heart Fail. 9:325-335. doi:10.1016/j.jchf.2021.01.013. PMID: 33714745.

Eisenstein EL, Prather K, Greene SJ, et al. 2019. Death: the simple clinical trial endpoint. Stud Health Technol Inform. 257:86-91. doi:10.3233/978-1-61499-951-5-86. PMID: 30741178.

Eisenstein EL, Sapp S, Harding T, et al. 2022. Ascertaining death events in a pragmatic clinical trial: insights from the TRANSFORM-HF trial. J Card Fail. S1071916422000549. doi:10.1016/j.cardfail.2022.01.020. PMID: 35181553.

Fellegi IP, Sunter AB. 1969. A theory for record linkage. J Am Stat Assoc. 64(328):1183-1210. doi:10.1080/01621459.1969.10501049.

Hammill BG, Hernandez AF, Peterson ED, Fonarow GC, Schulman KA, Curtis LH. 2009. Linking inpatient clinical registry data to Medicare claims data using indirect identifiers. Am Heart J. 157(6):995–1000. doi:10.1016/j.ahj.2009.04.002. PMID: 19464409.

Lauer MS, Blackstone EH, Young JB, Topol EJ. 1999. Cause of death in clinical research: Time for a reassessment? J Am Coll Cardiol. 34(3):618–620. doi:https://doi.org/10.1016/S0735-1097(99)00250-8. PMID: 10483939.

Lloyd-Jones DM, Martin DO, Larson MG, Levy D. 1998. Accuracy of death certificates for coding coronary heart disease as the cause of death. Ann Intern Med. 129(12):1020–1026. doi:10.7326/0003-4819-129-12-199812150-00005. PMID: 9867756.

National Center for Health Statistics. National Death Index. https://www.cdc.gov/nchs/ndi/. Accessed June 17, 2018.


National Research Council. 2009. Vital Statistics: Summary of a Workshop. Washington, DC: National Academies Press. doi:10.17226/12714. PMID: 25032356.

National Technical Information Service. 2011. Important Notice: Change in Public Death Master File Records. https://classic.ntis.gov/assets/pdf/import-change-dmf.pdf. Accessed June 17, 2018.

Death Information in the Research Identifiable Medicare Data | ResDAC. https://resdac.org/articles/death-information-research-identifiable-medicare-data. Accessed August 24, 2022.

Social Security Administration. 1983. Compilation of the Social Security Laws. https://www.ssa.gov/OP_Home/ssact/title02/0205.htm. Accessed June 17, 2018.

Navar AM, Peterson ED, Steen DL, et al. 2019. Evaluation of mortality data from the Social Security Administration Death Master File for Clinical Research. JAMA Cardiol. 4(4):375-379. doi:10.1001/jamacardio.2019.0198 PMID: 30840023.

Young JC, Pack C, Gibson TB, et al. 2021. Machine learning can unlock insights into mortality. JMIR Public Health & Surveillance. 111(Suppl 2):S65–S68. doi: 10.2105/AJPH.2021.306418. PMID: 34314195.

Warren JR, Milesi C, Grigorian K, Humphries M, Muller C, Grodsky E. 2017. Do inferences about mortality rates and disparities vary by source of mortality information? Ann Epidemiol. 27(2):121–127. doi:10.1016/j.annepidem.2016.11.003. PMID: 27964929.


Version History

March 2, 2026: Updated as part of annual review (changes made by K. Staman).

February 22, 2024: Updated section on using the NDI (changes made by K. Staman)

September 30, 2022: Added references and updated text and figures (changes made by K. Staman and L. Stewart)

July 2, 2020: Minor corrections to layout and formatting (changes made by D. Seils).

Published February 28, 2019.

Futility Assessment V. 2 – ARCHIVED

ARCHIVE Data and safety monitoring


Section 7

Futility Assessment V. 2 – ARCHIVED

A thorough discussion of the arguments for and against early termination for futility in ePCTs has been published elsewhere (Ellenberg et al 2015). An important consideration is that when treatments in common use are studied, as is generally the case in ePCTs, particularly strong evidence may be needed to persuade clinicians of the reliability of the results. Clinicians accustomed to administering a particular therapy may not be convinced that another therapy is as effective when the trial is small. Further, if both treatments are in common use, there should be no ethical concern about continuing a study even when it appears that the effects of the treatments are similar. Additionally, even small differences in outcomes may be informative in some cases when treatments are widely used. DMCs and sponsors should work together to determine thresholds for early termination of a trial before trial startup.

SECTIONS

CHAPTER SECTIONS

REFERENCES

back to top

Ellenberg SS, Culbertson R, Gillen DL, Goodman S, Schrandt S, Zirkle M. 2015. Data monitoring committees for pragmatic clinical trials. Clin Trials. 12:530–536. doi:10.1177/1740774515597697.


Version History

July 3, 2020: Minor corrections to layout and formatting (changes made by D. Seils).

December 13, 2018: Updated description of futility assessment as part of annual content update (changes made by L. Wing).

Published August 25, 2017- Version 1 Archived

Dissemination to Patients

ARCHIVED PAGE

Archived on November 26, 2025. Go to the latest version.

Dissemination Approaches For Different Stakeholders


Section 5


Dissemination to Patients

Returning Individual Research Results to Participants

Historically, returning individual research results to study participants has not been a standard or common practice. The longstanding justifications for this are that 1) there are risks associated with the return of potentially inaccurate results to participants, 2) research is designed for the benefit of society, not individuals, and 3) participants may have a “therapeutic misconception” and mistakenly believe the research will yield results that will benefit their clinical care (Botkin et al, 2018). Recently, the National Academies of Sciences, Engineering, and Medicine (NASEM) spearheaded a committee charged with determining if and when it is appropriate to return individual research results. The committee produced a NASEM Consensus Report in which they recommend that research results be shared with patients more often to support the development of trust and to demonstrate respect for participants (Committee on the Return of Individual-Specific Research Results Generated in Research Laboratories et al. 2018).

As background, there are currently two contrasting rules regarding the return of results:

The NASEM committee recommends a transition away from these rules in favor of a process-oriented approach that emphasizes transparency and communication of results to research participants. Clinical information is potentially valuable to participants, and this value should be considered in balance with the feasibility of returning results on a study-by-study basis to determine whether and how to return these results. It may be more feasible to return results from a traditional, explanatory trial that uses informed consent, because investigators will be able to explain the timing and the content of the results that will be returned to participants. However, if consent is waived, as is often the case with ePCTS, then returning results to participants is more complicated. There are many questions to be answered when it comes to returning results, such as: What data should be returned? When and how often? How do we contextualize the results and minimize potential harms? How should clinicians be involved? (Wong et al 2018). More work is needed to test processes and techniques and determine best practices for returning results, particularly for ePCTs. Additionally, effective communication strategies for returning results are needed, such as innovative methods for enhancing the quality of the reports for participants.

Dissemination Options for Trial Results

Lay audiences, including patients, caregivers, and others who are not experts in clinical research, often do not have access to clinical journals. Therefore, alternative dissemination media to scientific publications may be the most appropriate. Community-based stakeholders may already have communication channels open to patients and caregivers, and teaming with these stakeholders from the beginning can help formulate the appropriate messages and the best means for disseminating results.

Key Point: When communicating to stakeholders who are not routinely engaged in the clinical research enterprise, ensure that the information is accessible by disseminating through the following:

  • Patient advocacy groups
  • Government and study-specific websites
  • Newsletters
  • Emails
  • Social media
  • News media

An example of a study-specific website is the ADAPTABLE (Aspirin Dosing: A Patient-centric Trial Assessing Benefits and Long-Term Effectiveness) trial which is comparing the effectiveness of two daily doses of aspirin (81 mg vs 325 mg). The consent form and protocol for ADAPTABLE are available on the study website.

Case Study: Interactive Autism Network

A good example of a dissemination tactic aimed at patients and their caregivers comes from one of the Patient Centered Clinical Research Network’s (PCORnet’s) Patient-Powered Research Network partner, the Interactive Autism Network (IAN). Information about upcoming studies, opportunities to enroll in studies, and summary results from research are all disseminated through the network’s website. Notably, the summary results from IAN studies are written in clear, easy-to-read language (see figure); at the end of each article, additional resources are provided, as well as a reference list for the scientific literature cited in the article.

Summary Results Posted at iancommunity.org

  • IAN research participants include approximately 15,000 children and 7,500 adults with autism, 22,000 parents, and 13,000 siblings.
  • IAN has connected people with autism and their families to 500 research studies, and, thanks to IAN research participants, the IAN team has produced 31 scientific research papers. IAN’s research on elopement has influenced policy.
  • The IAN community website has about 1,000 articles highlighting research on autism treatments and therapies, challenging behaviors, early intervention, genetic discoveries, social issues, healthcare, the transition to adulthood, and adult issues.

Plain Language

When disseminating information to patients and other stakeholders, the use of plain language that is clear, professional, and easy to understand is recommended. The National Institutes of Health (NIH) has created a one-page guide to clarify the difference between observational studies and randomized clinical trials, but this guide does not communicate information about the unique aspects of pragmatic clinical trials, such as what is meant by embedded research, cluster randomized trials, or stepped wedge designs. Communications aimed at a broader audience, such as the public, should explicitly define these terms. For communicating the results, the NIH has also created a Checklist for Communicating Science and Health Research to the Public.

In brief, NIH recommendations for clinical trials are:

  • Describe the clinical trial phase
  • Give a breakdown of the study participants’ demographics
  • Identify and explain the limitations of the study’s endpoint
    • Surrogate endpoints
    • Composite endpoints
  • Check the study’s sample size and address potential limitations
  • Clearly explain risk
    • Absolute risk
    • Relative risk/risk ratio
  • Discuss both the benefits and drawbacks

To communicate the results of pragmatic (or embedded) research, we recommend adding the following information:

  • Brief background about why the project is important and the gaps in knowledge the project is intended to address
  • Rationale for a pragmatic approach, including an explanation of the specific design (cluster randomized, stepped wedge, etc.)
  • Decisions the trial is intended to inform for the patient, caregiver, and clinician
  • Use of data from the EHR and the privacy protections
  • Generalizability of results

Storytelling

Another dissemination tactic is to use storytelling methods. Presenting factual data and personal stories has been found to help people use the information and results from studies. Brason Lee commented in an American Journal of Public Health commentary:

“It is about writing reports in a way that inspires readers to care enough to move forward. It is about showing readers rather than telling readers what it is like to be in a given situation….one of the greatest challenges in disseminating research for public policy use may ultimately rest in how the story is packaged for presentation.” (Lee 2015)

The communications departments in universities, research institutions, and healthcare systems can provide invaluable help in making a message clear and compelling.

Resources for Patients

CERTAIN Patient Advisory Network's INSPIRE Research Portal is an online library of resources designed for patients and researchers partnering on patient-centered outcomes research (PCOR), which is described as healthcare studies that actively engage patients in the research process from start to finish.  The portal includes resources for patients and researchers to use together, as well as those specific to each group.

When patients are involved in research projects, it can be helpful to provide them with additional resources, including:

Resource Description
Clinical Trials Transformation Initiative: Clinical Trial Basics  Provides lessons on clinical trials, the phases of a clinical trial and patient engagement across the different phases.
Basic Research Concepts A web-based tutorial from the Department of Health and Human Services on basic research concepts for people who are new to research.
CITI Human Subjects Research Training  Provides a foundational training in participant protections and includes the historical development of human subject protections, ethical issues, and current regulatory and guidance information.

SECTIONS

CHAPTER SECTIONS

REFERENCES

back to top

Botkin JR, Wilkins C. 2018. Returning Individual Research Results to Participants: Guidance for a New Research Paradigm. NIH Collaboratory Grand Rounds. https://rethinkingclinicaltrials.org/news/september-21-2018-returning-individual-research-results-to-participants-guidance-for-a-new-research-paradigm-jeffrey-botkin-md-mph-consuelo-wilkins-md-msci/ Accessed Nov 2018.

Committee on the Return of Individual-Specific Research Results Generated in Research Laboratories, Board on Health Sciences Policy, Health and Medicine Division, and National Academies of Sciences, Engineering, and Medicine. 2018. Returning Individual Research Results to Participants: Guidance for a New Research Paradigm. Edited by Jeffrey R. Botkin, Michelle Mancher, Emily R. Busta, and Autumn S. Downey. Washington, D.C.: National Academies Press. https://doi.org/10.17226/25094. PMID: 30001048.

Lee B. 2015. Storytelling to enhance the value of research. Am J Public Health. 105:e1–e1. doi:10.2105/AJPH.2014.302548. PMID: 25713935.

Wong CA, Hernandez AF, Califf RM. 2018. Return of Research Results to Study Participants: Uncharted and Untested. JAMA. 320(5):435. doi:10.1001/jama.2018.7898. PMID: 29931289.


Version History

June 12, 2020: Added Grand Rounds to the Resources bar (changes made by K. Staman).

December 16, 2018: Updated and added text and references as part of annual review. Added section on returning results to individual participants (changes made by K. Staman).

Published August 25, 2017 – Version 1 Archived

Deciding Who to Engage

Building Partnerships and Teams to ensure a successful trial

Section 3


Deciding Who to Engage

The video and table below describe the range of partners that might participate in a PCT. Not every partner is relevant to every PCT or at every stage of the research, but identifying these at the outset will set the stage for effective engagement. One approach to determining which categories of partners are important for a particular PCT is to consider the following questions: 1) Who can help minimize potential barriers to study completion? and 2) Who will use the evidence from the study to make decisions or be affected by those decisions? For PCTs conducted in the context of healthcare delivery, healthcare delivery organization leaders, clinicians, and patients will always be important partner groups (Moloney et al. 2016).

Watch the video module: Building a Study Team for a Pragmatic Clinical Trial

Potential PCT Partners

Partners Description
Patients, caregivers, and consumer advocacy groups Current and potential consumers of healthcare, their caregivers, families, and patient and consumer advocacy groups
Clinicians Physicians, nurses, mental health professionals, pharmacists, paramedics, and other providers of care and support services
Healthcare delivery organization leaders Chief executive officers, chief financial officers, chief operations officers, chief medical officers, directors, and other executive-level leaders or senior management within health systems, hospitals, skilled nursing facilities, and other healthcare delivery organizations
Operational personnel Operational managers, IT, billing, compliance, and other business operations staff
Payers and purchasers Private insurers, Medicare, Medicaid, employers, the self-insured, and state, government, and other entities responsible for reimbursing or underwriting the costs of healthcare
Policy-makers and regulators Department of Health and Human Services (e.g., US Food and Drug Administration, Office for Human Research Protections), Congress, the White House, states, professional associations, and other regulating or policy-making entities and their intermediaries
Research funders Government and private funders of research
Researcher Academic, industry, clinical, or patient investigator with a question
Product manufacturers Manufacturers of drugs and medical devices, electronic health record vendors
Medical Societies Medical Societies, such as the American College of Surgeons, may generate guidelines and best practices and may help disseminate findings.

Adapted from (Concannon et al. 2012)

For researchers who are not part of a large academic organization or who have not partnered with stakeholders before, deciding who, when, and how to engage can be a challenge. The solution will be different depending on the particular scenario, but a good place to start is with someone who can champion the project and provide a warm introduction to the partner. Other ways to find partners is by attending conferences and networking, and by identifying learning health systems that value doing partnered pragmatic research.

After individuals have been identified, there are many different ways to engage them:

  • Advisory groups: The research team for STOP CRC, an NIH Collaboratory Trial, collaborated with an existing patient advisory council in some of their participating health centers to get feedback on the materials they used (wordless instructions for colorectal cancer screening kits). The PIs also formed an advisory board with a representative from each center, payers, and researchers.
    • “You don’t know what kind of magic will happen when they are all in the same room together.”—Gloria Coronado, PhD
    • Advisory boards can include healthcare delivery organization leaders, clinicians, operations personnel, patients, caregivers, patient advocacy groups, payers and purchasers, policymakers and regulators, research funders, researchers, and product manufacturers.
  • Collaborative pitching and co-design: Involving partners from the very beginning can produce strong partnerships and champions, and will help identify values, priorities, and perspectives that will be important throughout the research continuum.
  • IDEO.org is a group that focuses on “human-centered design” and offers free resources about different ways to engage partners.

Healthcare Delivery Organization Leaders

Because PCTs are typically conducted using information in the electronic health record (EHR) and as part of routine care, they could not occur without the partnership and buy-in of a healthcare delivery organization. To illustrate the importance of health system leader engagement, we gathered healthcare systems leaders for a panel modeled after the Shark Tank TV show. In the video, Dr. Greg Simon is tasked with convincing healthcare system leadership to invest in implementing the intervention from the Suicide Prevention Outreach Trial (SPOT).

Panelists (or sharks) include:

  • Susan Mullaney, President of Kaiser Foundation Health Plan of Washington
  • Edward Septimus, formerly Vice President for Research and Infectious Disease at HCA Healthcare and currently a Clinical Professor at Texas A&M Medical School
  • Matt Hough, Medical Director of Jackson Care Connected Care, Oregon

Several national initiatives have been involved in investigating challenges and practical strategies for integrating research in the setting of clinical care (Institute of Medicine 2013). According to a 2014 survey, health system executives are interested in research studies that support organizational performance goals; provide data to drive decision-making; enhance delivery-system reputation and national and community connections; and ultimately support the goal of high-quality, patient-centered care at a reasonable cost (Institute of Medicine 2015; Larson and Johnson 2015). Leaders were enthusiastic regarding the prospect of integrating knowledge generation into care, but wanted to minimize the impact of the research process on clinical operations and improve the speed and availability of research results. Healthcare delivery organization leaders are often gatekeepers, defined as “people or entities who can allow or deny access to resources required to support the conduct of clinical research.” (Patterson et al. 2011; Whicher et al. 2015). These individuals play a critical role in setting up an effective context to test the trial and in determining which PCTs are implemented and if the results of the trial become routine care. Aside from the essential early engagement with healthcare delivery organization leaders, operational personnel can offer insight crucial to the success of a PCT, such as an understanding of existing infrastructure and clinical workflows.

A lesson emphasized by Gregory Simon, MD, principal investigator of one of the NIH Collaboratory Trials is, “researchers often have a tail-wagging-the-dog problem… we need to remember that we’re the tail and the healthcare system is the dog” (see full interview).

While the clinical and public health questions that motivate a pragmatic trial may apply across all health systems, local priorities often vary. Individual health systems face different local business environments, serve different patient populations, and may have different care improvement programs already in progress. When engaging with potential research partners, investigators should recognize that research question of high interest to one health system may hold little interest for an otherwise similar health system if it competes or conflicts with other programs planned or in progress.

Clinicians

Even a highly developed and centralized healthcare delivery infrastructure does not obviate the need for local-level engagement with front-line clinicians and staff to facilitate successful trial completion (Tunis et al. 2016). Collaboratory investigators have cited the value of clinician engagement and how it is an important challenge to conducting PCTs. Overall, PCT researchers should have a communication plan, design training approaches that can be available on demand (e.g., recorded webinars) and updated as needed, be prepared to learn from their health system partners, and be flexible, adapting as needed to the dynamic study environment. Re-training and re-engagement will be needed due to staff turnover.

Recent insights about engaging front-line clinicians in PCTs suggest how important it is to involve clinicians in designing studies that are feasible in the context of clinical care (Tambor et al. 2020). Research teams should adapt the study protocols to fit workflows that may be unique to a specific clinic and be flexible in their approach to involving clinicians in recruitment and enrollment. For example, a higher or lower level of involvement by clinicians would likely depend on the number of eligible patients in the system, how robust the electronic infrastructure is for outreach, whether there are site-level champions, and how complex the PCT intervention is.

Successful trial implementation is more likely when researchers take the time to build awareness and buy-in at every level of the organization, identify clinician and staff champions, develop a detailed understanding of site-level operations, and adapt study protocols to accommodate individual preferences and workflow. (Tambor et al. 2020)

Some of the key issues with regard to engaging clinicians are described in the Grand Rounds, “Straight from the Source: Clinicians’ Views on Participating in CER/PCOR,” given by Ellen Tambor MA, Rachel Moloney, MHS, and  Sean Tunis, MD.

  • Qualitative, empirical evidence pertaining to clinician participation in comparative effectiveness and patient-centered outcomes research (CER/PCOR) is very limited.
  • Literature has shown that the biggest motivations for clinician involvement in research are improving patient care and contributing to clinical knowledge, rather than recognition or financial motives.
  • Early and ongoing engagement builds clinician trust, enthusiasm, confidence, and commitment in pragmatic trials.
  • Focus groups with clinicians made it clear that clinicians want to be involved in early stages of study design and want to protect their patients from feeling like “guinea pigs.”

Patients

Including patients as partners throughout the research process through meaningful engagement can help PCTs be more patient centered, and may be a requirement for some research funding. Patient representatives might include individuals with lived experience of the disease or condition in question, family members or caregivers, or representatives from patient or consumer advocacy organizations. Decisions about who to include should be based on the topic and stage of research, the role patient representatives will be asked to play, the type of input that is needed, and the types of skills or experience required to participate meaningfully, among other factors. If relationships with patients and advocates do not already exist, advocacy organizations relevant to the disease or condition under study may be able to help identify patients who would be willing to serve as representative, or alternatively, to appoint a representative from their organization. Clinicians involved with the trial can also help to identify patient representatives. PCT researchers should be prepared to build a trusting relationship, and to learn from, train, and provide time and space to collaborate with patient representatives.

A panel funded by the Patient-Centered Outcomes Research Institute (PCORI) published recommendations for the oversight of patients who participate in research roles other than as “research participant" (Gelinas et al. 2018). When patients and caregivers participate in roles such as co-investigators, study personnel, and advisors in research studies, novel ethical and regulatory challenges could develop. The panel provides a taxonomy for these roles and recommendations for appropriate oversight. The group also provides recommendations about identifying and engaging a diverse mix of patients and developing mechanisms to protect against possible conflicts of interest.

In an accompanying editorial, Dr. Robert Califf expressed his support for the panel’s efforts and their taxonomy for patients in patient-centered outcomes research:

“The differences among being a subject of research, offering advice or perspectives about a research project, and playing a role as a researcher are important and deserve special consideration in the context of ethical and oversight frameworks governing research.” — (Califf RM. 2018)

Case Study: Partnering With Patients in the PREPARE Trial

The PREPARE (Person EmPowered Asthma Relief) trial, a recent PCORI-sponsored PCT coordinated by the Duke Clinical Research Institute (co-PI, Frank Rockhold, PhD), was designed to find a way to improve moderate-to-severe asthma outcomes for Black and Latinx patients. Engaging patient partners throughout the trial was shown to be successful in both giving patients a direct impact on study approaches and lowering the burden for providers. Seventeen patient advisors were included in the study’s partner group. These advisors were instrumental in helping understand the study populations and potential barriers to participation. In addition to reviewing all patient-facing study materials, the patient advisors emphasized the importance of simple messaging, identifying clinics that treat the target populations, using the specific Spanish vernacular, giving adequate and immediate payment for survey completion, and sending appreciation notes from investigators. The study team consulted with the patient advisors during the course of the trial to update the video instructions and adapt survey questions to increase participants’ understanding.

There were also challenges of partnering with patients, as most patient advisors had no research background and many members of the research team and professional societies had never worked with patients in an advisory capacity. The study team highlighted potential solutions to address such challenges:

  • Include on the operations team a full-time bilingual engagement project manager, a part-time asthma educator who works with the community, and a nurse consultant expert in patient experience and patient advisory councils
  • Educate patient partners on study design principles and statistics
  • Provide consultation-level compensation for patient advisors
  • Maintain continuous involvement in decisions from study design through analysis
  • Prior to the annual in-person board meetings, schedule a meeting with patient advisors to explain the major issues that will be discussed and at the board meeting; ensure that a patient partner is at each table and breakout group

Watch the Grand Rounds Presentation with Dr. Elliot Israel from June 17, 2022: PREPARE: A Successful, Primarily Remote Pragmatic Trial in Black and Latinx Population with Asthma: Challenges and Successes.

Other Partners

Other potential stakeholders include healthcare payers, policy-makers, and guideline developers who rely on the evidence from clinical trials to inform decisions that may affect large populations of patients and consumers. This case study from the Strategies and Opportunities to Stop Colorectal Cancer (STOP CRC) in Priority Populations trial, illustrates one example of engaging with payers.

It may also be appropriate to confer with policy-makers, guideline developers, and medical societies to see if any new guidelines are slated for release during the conduct of the trial that may impact the results or outcomes of the PCT. Additionally, one can partner with these partners to determine what evidence is needed to support future guidelines. For example, Trauma Survivors Outcomes and Support Trial (TSOS) was developed in partnership with American College of Surgeons Committee on Trauma so the findings from pragmatic trials could be integrated into guidelines that regulate trauma care nationally. (For more, see the case study).

Enlisting the involvement of these partner groups can be made easier if the PCT addresses questions that are of particular relevance. In some cases, it may also be useful to engage with relevant product manufacturers, consumer advocacy groups, or professional societies. However, in all cases, care should be taken to ensure that the interests of one partner do not have undue influence on the research process.

SECTIONS

CHAPTER SECTIONS

REFERENCES

back to top

Califf RM. 2018. A Beginning to Principles of Ethical and Regulatory Oversight of Patient-Centered Research. Ann Intern Med. 169(8):579-580. doi: 10.7326/M18-2517. PMID:30264090.

Concannon TW, Meissner P, Grunbaum JA, et al. 2012. doi:10.1007/s11606-012-2037-1. PMID: 22528615.

Gelinas L, Weissman JS, Lynch HF, et al. 2018. Oversight of Patient-Centered Outcomes Research: Recommendations From a Delphi Panel. Ann Intern Med. 169(8):559-563. doi: 10.7326/M18-1334. PMID:30264127.

Institute of Medicine. 2013. Best Care at Lower Cost: The Path to Continuously Learning Health Care in America. Smith M, Saunders R, Stuckhardt L, McGinnis JM, editors. Washington, DC: National Academies Press. https://www.nap.edu/catalog/13444/best-care-at-lower-cost-the-path-to-continuously-learning. Accessed May 9, 2017.

Institute of Medicine. 2015. Integrating Research and Practice: Health System Leaders Working Toward High-Value Care: Workshop Summary. Washington, DC: National Academies Press. https://www.nap.edu/catalog/18945/integrating-research-and-practice-health-system-leaders-working-toward-high. Accessed May 9, 2017.

Larson E, Johnson K. 2015. Making new care models a reality requires closer collaboration between researchers and execs. Modern Healthcare. http://www.modernhealthcare.com/article/20150822/MAGAZINE/308229977. Accessed 2017 May 9.

Moloney RM, Tambor ES, Tunis SR. 2016. Patient and clinician support for the learning healthcare system: recommendations for enhancing value. J Comp Eff Res. 5:123–128. doi:10.2217/cer.15.67. PMID: 26930026.

National Institute for Health Research. 2016. The James Lind Alliance Guidebook. www.jla.nihr.ac.uk/jla-guidebook/downloads/JLA-Guidebook-Version-6-February-2016.pdf. Accessed May 9, 2017.

Patterson S, Mairs H, Borschmann R. 2011. Successful recruitment to trials: a phased approach to opening gates and building bridges. BMC Med Res Methodol. 11:73. doi:10.1186/1471-2288-11-73. PMID: 21595906.

Tambor E, Moloney R, Greene SM. 2020. One size does not fit all: Insights for engaging front-line clinicians in pragmatic clinical trials. Learning Health Systems. https://onlinelibrary.wiley.com/doi/full/10.1002/lrh2.10248.

Tunis S, Tambor E, Moloney R. 2016. Clinician Engagement in the NIH Collaboratory and Beyond. PCT Grand Rounds presentation; May 6, 2016.

Whicher DM, Miller JE, Dunham KM, Joffe S. 2015. Gatekeepers for pragmatic clinical trials. Clin Trials. 12:442–448. doi:10.1177/1740774515597699. PMID: 26374683.

ACKNOWLEDGMENT

back to top

Pearl O'Rourke of the NIH Pragmatic Trials Collaboratory's Ethics and Regulatory Core reviewed this section.


Version History

August 29, 2025: Made minor, nonsubstantive corrections to the text and added an acknowledgment section (changes made by D. Seils).

July 3, 2025: Added text on the impact of local priorities on health system participation in research (change made by E. McCamic).

October 5, 2023: Updated first sentence of PREPARE Case Study (change made by G. Uhlenbrauck).

October 3, 2022: Added Case Study Section. Added contributors. Edited reference (changes made by K. Staman and L. Stewart).

January 22, 2021: Added embedded video (change made by G. Uhlenbrauck).

November 12, 2020: Added journal article to the Resources sidebar discussing key stakeholders’ perspectives on the ethical challenges of pragmatic trials (changes made by L. Wing).

October 28, 2020: Added text and reference to Tambor et al. 2020 publication on clinician engagement (changes made by L. Wing).

February 24, 2020: Added Shark Tank video and accompanying text (changes made by K. Staman).

December 15, 2018: Updated by adding text an revising as part of annual review (changes made by K. Staman).

Published August 25, 2017 | version 1 – archived

Designing to Avoid Identification Bias – ARCHIVED

Experimental Designs and Randomization Schemes


Section 8

Designing to Avoid Identification Bias – ARCHIVED

Many PCTs rely on data from electronic health records, including screening measures and diagnosis codes collected as part of routine clinical care, to identify the study population of interest. Cluster randomized trials that use information from electronic health records to determine study population eligibility are prone to selection bias if the study interventions influence who undergoes screening or receives a diagnosis in clinical care. For example, if eligibility is determined by who receives a diagnosis during clinical care, patients identified as eligible in the intervention group may differ from patients identified in the usual care group, possibly with respect to important predictors of the study outcome, such as symptom severity.

Interventions that have the potential for selection bias can influence screening by design (ie, interventions specifically intended to increase screening or diagnosis rates) or as a byproduct (eg, an intervention to train physicians about how to treat a condition, thereby increasing awareness and yielding higher screening or diagnosis rates). This type of selection bias, which has been referred to as identification bias (Eldridge et al 2009; Eldridge et al 2016), can be attributed to selecting the analysis sample after randomization of the clusters (see Figure). This phenomenon is analogous to selection bias that can occur in standard randomized clinical trials when the analysis is conditioned on a variable measured after randomization that could be influenced by the intervention assignment, such as in a complete case analysis (Mansournia et al 2017; Hernán et al 2004).

In this section, we provide 3 examples of cluster randomized PCTs in which identification bias may be a concern. We describe possible approaches to addressing identification bias in these trials and outline considerations for the design and analysis of PCTs when there is the potential for differential selection of study participants depending on the intervention assignment.

Figure Identification Bias

Figure. Schematic illustrating situations in which an analysis may be affected by identification bias in (A) a parallel-group design or (B) a stepped-wedge design. Gray areas indicate assignment to the intervention group; white areas correspond to the control group.
* Stepped-wedge trials randomly assign clusters to the sequence of the intervention that will be given.

PROUD Cluster Randomized Trial

The Primary Care Opioid Use Disorders Treatment (PROUD) trial (NCT03407638) is a pragmatic, cluster randomized, parallel-group trial to evaluate a program for increasing medication-based treatment of patients with opioid use disorders in 12 clinics within 6 healthcare systems. A main objective of the study is to evaluate whether the intervention reduces the use of acute care services among patients with opioid use disorders.

The intervention in the PROUD trial is expected to increase diagnoses of opioid use disorders among patients previously seen in the clinics, and to attract new patients not previously seen in the clinics or the healthcare system overall. To capture all patients who may be affected by the intervention, the study team considered including all patients with a diagnosis of opioid use disorders in the primary analysis, including those diagnosed after randomization. However, because patients diagnosed after their clinic has been assigned to the intervention group may differ from patients diagnosed after their clinic has been assigned to the control group (ie, they may be either sicker or healthier), an analysis that includes all patients could lead to bias in estimates of treatment effect. On the other hand, because opioid use disorders are underdiagnosed—meaning only a small proportion of persons affected by opioid use disorders receive a diagnosis documented in the electronic health record—an analysis restricted to patients with a diagnosis before randomization, while avoiding the potential for identification bias, may not reflect the broader population of patients with opioid use disorders who could be affected by the intervention.

To address these trade-offs, the primary analysis in the PROUD trial will include patients with a diagnosis of opioid use disorders before randomization to avoid the potential for selection bias, and secondary analyses will consider patients diagnosed after randomization. (Power calculations for the study indicated there would be sufficient statistical power in the primary analysis of patients diagnosed before randomization, even though opioid use disorders are underdiagnosed.) To address the potential for identification bias, the secondary analyses will adjust for measured variables associated with the outcome and with differences across study arms in who is newly diagnosed after randomization. A sensitivity analysis will explore the potential for selection bias due to unmeasured factors.

SPARC Stepped-Wedge Trial

The Sustaining Patient-Centered Alcohol-Related Care (SPARC) trial (NCT02675777) is a pragmatic, stepped-wedge trial to evaluate a program integrating alcohol-related care into primary care compared with usual primary care in 22 primary care clinics at Kaiser Permanente Washington. One of the main study outcomes is treatment for alcohol use disorders documented in the electronic health record.

Before the trial began, screening rates for unhealthy alcohol use were lower than 20%. Because a key component of the SPARC intervention is to screen all patients in primary care, screening rates are anticipated to greatly increase in the intervention arm, with a target of 80%. As a result of the increased screening, diagnosis rates for alcohol use disorders are also expected to increase. Expansion to near universal screening of patients in primary care will likely lead to differences in characteristics of patients diagnosed with alcohol use disorders in the intervention period compared to the usual care period. Consequently, an analysis of the entire study population of patients with a diagnosis (including both pre- and postrandomization diagnoses) to evaluate changes in treatment rates could be affected by selection bias. On the other hand, an analysis restricted to patients diagnosed before randomization would reflect a small, highly selected population that may not be generalizable to the broader population of persons with alcohol use disorders.

Another risk of restricting the analysis to patients identified before randomization in a stepped-wedge design (Figure) is the potential loss of statistical power resulting from some patients leaving their assigned clinic before the intervention period, which becomes increasingly likely at clinics that implement the intervention later in the study. An alternative approach would be to define a separate "baseline" period for each cluster (eg, a 1-year period before crossing over from control to intervention) and to identify patients for inclusion in analyses using data from this baseline period. Because baseline periods for some clusters would occur after the crossover time for other clusters, such an approach may still be affected by identification bias (eg, if patients from a clinic with a later crossover time receive care in a clinic that has already crossed over to the intervention period).

To address these competing concerns, the planned SPARC analysis will include the entire population of patients who visit the clinic (before and after randomization) as the denominator for the main study outcomes, because the intervention is not expected to alter this population. Although the effect of the SPARC program on changing rates of treatment for alcohol use disorders is diluted in the entire population (since most patients do not have alcohol use disorders), power calculations indicated sufficient statistical power to detect hypothesized changes in the main study outcomes.

STOP CRC Cluster Randomized Trial

The Strategies and Opportunities to Stop Colorectal Cancer in Priority Populations (STOP CRC) trial (NCT01742065), one of the NIH Collaboratory Trials, was a cluster randomized, parallel-group trial conducted in 26 Federally Qualified Health Center clinics. The objective of the trial was to test the effectiveness of a health system–level intervention designed to improve colorectal cancer screening rates. The intervention involved giving clinic staff access to an electronic health record registry tool to facilitate sending fecal immunochemical test (FIT) kits to patients who were not up to date with US Preventive Services Task Force guidelines for colorectal cancer screening.

The analytic sample in the STOP CRC trial included all patients who were not up to date with colorectal cancer screening guidelines at the time of randomization, as well as those who became out of date at any point during the subsequent 12 months. It is the inclusion of this latter group that allows for the possibility of selection bias. For example, suppose some patients are less likely to complete the colorectal cancer screening than others (eg, some patients are "more predisposed to health screening" and some are "less predisposed to health screening"). If clinic staff become more proactive about colorectal cancer screening and begin distributing FIT kits to patients before they become overdue for screening, and a higher proportion of the "more predisposed" patients complete the screening, then patients who become out of date with screening (and therefore eligible to be included in the primary analysis) would be more likely to be those patients who are less predisposed to health screening. In other words, the pool of patients most likely to return a FIT kit could become depleted in the intervention group before they become eligible for the analysis. This could lead to bias in the estimated intervention effect, in this case making the intervention effect look artificially low.

The study's analysis plan addressed this in 2 ways. First, the primary analysis adjusted for several patient-level factors that could be associated with the outcome or with completing screening before becoming overdue. This helps to address potential selection bias due to measured but not unmeasured factors. Second, the investigators took advantage of the fact that the intervention was rolled out to control clinics in the second year after randomization to conduct a secondary analysis that used a stepped-wedge analysis approach. This analysis evaluated changes to the clinics’ National Quality Forum colorectal cancer screening scores for the year before randomization and for the 2 years after randomization. These scores used for their denominators all patients who qualify for colorectal cancer screening in each year, regardless of whether they were out of compliance, and hence should avoid this source of potential selection bias. A downside to this analysis is that it could dilute the intervention effect by including fully compliant patients who never qualified for the intervention.

Recommendations for Addressing Identification Bias

  • Consider defining the study population for the primary analysis based on baseline (ie, prerandomization) data. This could include using the entire clinic population as the denominator, or a relevant subgroup, such as patients with a prior diagnosis for the condition under study. The choice of subgroup will depend on statistical properties (eg, power) and scientific considerations (eg, interpretability of effect estimates).
  • If defining the study population to be included in analyses using postrandomization data, consider whether there are choices for the study population that may be less likely to be affected by treatment assignment. Some possibilities include using the entire clinic population, or, for a trial that is not expected to change the population screened or the population screening positive, an analysis of screened or screened-positive patients might be a good choice, respectively.
  • If the study population is defined based on postrandomization data, assess whether it is scientifically plausible that identification of the population may be affected by the treatment assignment. For example, if the screen used in both arms is the same and can also be used to assess symptom severity, the severity of symptoms in the eligible population in each of the arms could be compared. If the intervention plausibly changes who is identified as eligible, then using this postrandomization study population in secondary (rather than primary) analyses may be preferred, as the analysis may be subject to selection bias. Adjusting for baseline characteristics among patients identified for inclusion in the study that differ across treatment arms can control for selection bias due to measured factors, but treatment effect estimates may still be biased due to unmeasured factors. Additional sensitivity analysis methods may be applied to investigate how treatment effect estimates vary across plausible values of the magnitude (and direction) of the potential selection bias (National Research Council 2011).
  • Depending on the scientific question and ethical considerations, alternatives to using usual care as a comparator that will induce a similar mechanism for identifying the study population across treatment arms may be explored (eg, comparing screening plus treatment A to screening plus treatment B).
  • Following recommendations for reporting of cluster randomized trials, authors should describe the timing of when the study population was identified relative to randomization and report the proportion of patients identified for inclusion in analyses across randomized treatment groups to elucidate the potential for identification bias (Eldridge et al 2009; Eldridge et al 2016).

Conclusion

The issue of selection bias due to conditioning the analysis on a population that is identified based on postrandomization data has been discussed previously in the context of “improper” subgroup analysis in clinical trials. Prior literature on improper subgroups has focused on developing guidelines for analyzing improper subgroups (Desai et al 2014); on discussing specific analytic tools for conducting such analyses, such as per-protocol analyses (Little et al 2009) or outcome-based subgroup analyses (Hirji and Fagerland 2009); and on comparing results from a single trial across different analytic methods (Pieper et al 2004). Literature on addressing identification bias in cluster randomized trials has focused primarily on settings where patients are formally recruited for inclusion in the study (Eldridge et al 2009). However, there has been little guidance on how to optimally design a pragmatic trial in settings where the intervention may affect identification of the primary study population of interest, particularly when the condition of interest is not well recognized in the population at baseline and recognition is increased (perhaps substantially) as a result of treatment assignment.

The 3 examples described above illustrate the potential ways studies may be affected by identification bias, as well as approaches for handling this source of bias. These approaches include defining the primary analysis based on the prerandomization sample to avoid identification bias while considering secondary analyses that incorporate postrandomization data (as in the PROUD trial); defining the study population using postrandomization data that are not expected to be altered by the intervention (as in the SPARC trial); and conducting sensitivity analyses to address the potential for bias (as in the STOP CRC trial). The choice of study population for the primary analysis in any particular study will depend on a variety of considerations, including the study design (eg, parallel-group versus stepped-wedge), scientific knowledge informing potential mechanisms by which identification of participants may be differentially affected across treatment groups, and other trade-offs, such as the ability to capture the complete effect of interventions for underdiagnosed conditions.

SECTIONS

CHAPTER SECTIONS

REFERENCES

back to top

Desai M, Pieper KS, Mahaffey K. 2014. Challenges and solutions to pre- and post-randomization subgroup analyses. Curr Cardiol Rep. 16:531. doi:10.1007/s11886-014-0531-2. PMID: 25135344.

Eldridge S, Kerry S, Torgerson DJ. 2009. Bias in identifying and recruiting participants in cluster randomised trials: What can be done? BMJ. 339:b4006. doi:10.1136/bmj.b4006. PMID: 19819928.

Eldridge S, Campbell M, Campbell M, et al. 2016. Revised Cochrane risk of bias tool for randomized trials (RoB 2.0): additional considerations for cluster-randomized trials. https://researchportal.port.ac.uk/portal/en/publications/revised-cochrane-risk-of-bias-tool-for-randomized-trials-rob-20(09bf163b-13fb-4776-833f-ab39984b4429).html. Accessed July 2, 2020.

Hernán MA, Hernández-Díaz S, Robins JM. A structural approach to selection bias. Epidemiology. 2004;15(5):615-625. doi:10.1097/01.ede.0000135174.63482.43. PMID: 15308962.

Hirji KF, Fagerland MW. 2009. Outcome based subgroup analysis: a neglected concern. Trials. 10:33. doi:10.1186/1745-6215-10-33. PMID: 19454041.

Little RJ, Long Q, Lin X. 2009. A comparison of methods for estimating the causal effect of a treatment in randomized clinical trials subject to noncompliance. Biometrics. 65:640-649. doi:10.1111/j.1541-0420.2008.01066.x. PMID: 18510650.

Mansournia MA, Higgins JP, Sterne JA, Hernán MA. 2017. Biases in randomized trials: a conversation between trialists and epidemiologists. Epidemiology. 28:54-59. doi:10.1097/EDE.0000000000000564. PMID: 27748683.

National Research Council (US) Panel on Handling Missing Data in Clinical Trials. 2010. Principles and methods of sensitivity analyses. In: National Research Council (US) Panel on Handling Missing Data in Clinical Trials. The Prevention and Treatment of Missing Data in Clinical Trials. Washington, DC: National Academies Press; 83-106.

Pieper KS, Tsiatis AA, Davidian M, et al. 2004. Differential treatment benefit of platelet glycoprotein IIb/IIIa inhibition with percutaneous coronary intervention versus medical therapy for acute coronary syndromes: exploration of methods. Circulation. 109:641-646. doi:10.1161/01.CIR.0000112570.97220.89. PMID: 14769687.


Version History

July 2, 2020: Minor corrections to layout and formatting (changes made by D. Seils).

May 27, 2020: Reordered the sections of this chapter as part of the annual content update (changes made by D. Seils).

Published February 8, 2019

Alternative Cluster Randomized Designs – ARCHIVED

Experimental Designs and Randomization Schemes


Section 6

Alternative Cluster Randomized Designs – ARCHIVED

CRT designs are commonly selected for PCTs, because individual-level randomization often raises practical implementation challenges and because outcomes within clusters tend to be correlated. There is an extensive literature on the inefficiency of simple cluster randomization (ie, parallel cluster randomization) compared to individual-level randomization and approaches to accounting for this inefficiency in terms of sample size (Donner et al 1981; Hsieh 1988; Donner 1992; Donner and Klar 1996; Campbell et al 2001). However, modified cluster randomized designs, such as cluster randomization with crossover, may reduce the required sample size and may be particularly feasible in PCTs in healthcare systems with electronic health records. In this section, we describe alternative design choices for cluster-with-crossover randomized trials and their implications for statistical power and sample size calculations.

Simple Cluster vs Individual-Level Randomized Trials

It is well known that simple CRTs have less statistical power than individual-level RCTs because of correlation within clusters. Specifically, in a trial designed to determine whether there is a significant difference between interventions A and B on response Y, randomization at the cluster level to either A or B would require a larger sample size to obtain the same statistical power as randomization at the individual level. The magnitude of loss of statistical power is related to the cluster size, the balance of cluster sizes, and the correlation within the clusters.

For a given sample size, statistical power increases as the number of clusters increases. This makes intuitive sense, in that as the number of clusters increases, the size of the clusters decreases toward 1, or individual-level randomization. Moreover, as the cluster sizes become more imbalanced, statistical power decreases (Eldridge et al 2009). Also, as correlation within a given cluster increases, power decreases. If there were no intracluster correlation, the power would be the same as with individual-level randomization.

Inefficiency is not the only problem with simple CRT designs. Another challenge is the potential for imbalance in baseline factors, especially with large clusters. For example, in study designs that involve clustering at the clinic level, individual clinics may differ in the size and demographic characteristics of their patient populations. These challenges may be overcome by adding a crossover, or a switch to the other intervention, within cluster during randomization.

Cluster With Crossover

We define a cluster-with-crossover design as a randomization design in which each cluster is randomly assigned to a study arm at the beginning of the study and, after a certain period of time, switches (ie, crosses over) to the other study arm. Timing the crossover to occur approximately halfway through the study achieves balance between the study arms, including balance on baseline factors.

A cluster-with-crossover design is only feasible if the intervention can be turned off and on without “learning,” such that residual practices are not carried over from the precrossover period to the postcrossover period. A carryover effect would cause contamination between the study arms. Implementing a washout period after the crossover, during which the data from the clusters are discarded, may help to prevent contamination, though washout periods are not always feasible. For example, in a device trial in which hospitals are randomly assigned to the device intervention or usual care, and in which the outcome of interest is patient survival, a carryover effect may occur despite a washout period due to the time sequence of other potential confounding treatments (eg, a new protocol introduced into the system that may improve survival midway through the trial). However, there would likely be a balance of these time effects across the study arms.

When a cluster-with-crossover design is feasible, it is statistically more efficient than individual-level randomization in certain situations. However, we do not advocate the cluster-with-crossover approach over individual-level randomization, because of challenges with feasibility (ie, turning the intervention on and off) and carryover effects, but as a viable alternative to simple cluster randomization. The efficiency gained with a cluster-with-crossover design is similar to that gained from a paired t test over an independent t test. More power is gained as the between-period correlation within cluster increases (Li et al 2018). Furthermore, when the precrossover and postcrossover periods are balanced, statistical power may actually increase. As the periods become less balanced, power decreases and the study design moves toward a simple cluster randomized design.

Cluster With Partial Crossover

If an intervention cannot be turned off and on, another simple alternative is to collect data from all clusters during a baseline period (ie, before the intervention is introduced), then assign half of the clusters to the intervention and continue to collect data. This approach involving an untreated baseline period followed by parallel cluster randomization has statistical advantages because data are available from some clusters to efficiently estimate a within-cluster effect without the potential for “learning” contamination, or carryover effect, that could occur with cluster-with-crossover designs. Moreover, if outcome data are already being collected through the electronic health record or medical billing claims, this design is more powerful than a simple CRT design without cost to the study, because the data are already available and easily obtained. A limitation of the design is that not all clusters receive the intervention, unlike other designs such as the stepped-wedge trial.

Next Steps

To implement new cluster-with-crossover designs, there is a need for sample size calculations that are more feasible than currently available simulation approaches. These calculations require derivation of variance formulas for different designs incorporating the potential for unbalanced cluster sizes or crossover periods. The NIH Collaboratory's Biostatistics and Study Design Core is working on deriving these formulas for future trials.


SECTIONS

CHAPTER SECTIONS

REFERENCES

back to top

Campbell MK, Mollison J, Grimshaw JM. 2001. Cluster trials in implementation research: estimation of intracluster correlation coefficients and sample size. Stat Med. 20:391-399. PMID: 11180309.

Donner A. 1992. Sample size requirements for stratified cluster randomization designs. Stat Med. 11:743-750. PMID: 1594813.

Donner A, Birkett N, Buck C. 1981. Randomization by cluster. Sample size requirements and analysis. Am J Epidemiol. 114:906-914. PMID: 7315838.

Donner A, Klar N. 1996. Statistical considerations in the design and analysis of community intervention trials. J Clin Epidemiol. 49:435-439. PMID: 8621994.

Eldridge SM, Ukoumunne OC, Carlin JB. 2009. The intra-cluster correlation coefficient in cluster randomized trials: a review of definitions. Int Stat Rev. 77:378-394. doi:10.1111/j.1751-5823.2009.00092.x.

Hsieh FY. 1988. Sample size formulae for intervention studies with the cluster as unit of randomization. Stat Med. 7:1195-1201. PMID: 3201045.

Li F, Forbes AB, Turner EL, Preisser JS. Power and sample size requirements for GEE analyses of cluster randomized crossover trials. Stat Med. 2019;38(4):636-649. doi:10.1002/sim.7995. PMID: 30298551.


Version History

July 2, 2020: Minor corrections to layout and formatting (changes made by D. Seils).

May 5, 2020: Added the Resources sidebar as part of the annual content update (changes made by D. Seils).

August 5, 2019: Made nonsubstantive change to improve navigation (change made by D. Seils).

July 5, 2019: Updated link in author list (change made by D. Seils).

February 1, 2019: Updated link in author list (change made by D. Seils).

January 16, 2019: Made nonsubstantive changes to the text as part of the annual content update (changes made by D. Seils).

Published January 3, 2019

Case Study: STOP CRC Trial

Analysis Plan


Section 9

Case Study: STOP CRC Trial

This case study explores some of the challenges in pragmatic clinical trial design and analysis discussed in the previous sections. The case study uses the Strategies and Opportunities to Stop Colorectal Cancer in Priority Populations (STOP CRC) trial, one of the NIH Pragmatic Trials Collaboratory Trials, to illustrate how the study team dealt with pragmatic issues during the planning and conduct of the trial. In particular, the study team modified the planned analysis to better suit the final study design.

Overview of the STOP CRC Trial

Study Design

The STOP CRC trial was a cluster randomized pragmatic clinical trial embedded in 26 federally qualified health center clinics. The objective of the trial was to test the effectiveness of a healthcare system–level intervention designed to improve colorectal cancer screening rates. The intervention involved access to an EHR-based registry tool and training to facilitate sending fecal immunoglobulin test (FIT) kits to patients who were not up to date with US Preventive Services Task Force guidelines for colorectal cancer screening.

The participating clinics, each housed administratively in 1 of 8 health centers, served as the unit of randomization. The study team originally planned to use constrained randomization to ensure balance across potentially confounding covariates. However, on the basis of early simulation analyses during the project's developmental phase, the study team opted to use conventional stratified randomization whereby the health center was the stratification variable and assignments were blocked within health center to assure maximum possible balance within and across health centers.

Study Intervention

The study intervention consisted of 2 parts. First, the study team used a tool embedded in the EHR to create a registry that was updated daily. The registry displayed lists of patients who were due for each component of the intervention: a mailed introduction letter, a mailed FIT kit, and a mailed reminder letter. For example, an initial list showed all patients in the clinic who, at any given time, were not up to date with colorectal cancer screening and had not recently been ordered a FIT kit. Clinic staff used the registry to trigger mailings of FIT kits to eligible patients. The registry was the core of the intervention, though individual clinics were allowed flexibility in the frequency with which they used the registry to deliver mailings. The registry tool was made available to clinics at the time of randomization (February 2014), though an upgrade to the underlying EHR platform delayed implementation until June 2014. Control clinics gained access to the registry in August 2015.

Patient Accrual and Outcome Measurement

For both the intervention clinics and the control clinics, the study team identified all patients who entered the registry during the 12 months after randomization. The date on which patients first entered the registry was the start of follow-up for outcome assessment. The intended primary outcome was the return of a completed FIT kit within 12 months after the patient's start date. The follow-up period was redefined as the shorter of 12 months or the time until August 2015 because, for practical reasons, the study team determined that control clinics should have access to the intervention starting on that date. One reason for the long follow-up period was that the intervention clinics did not send the FIT kits as soon as patients became eligible. Rather, they used a variety of processes that allowed them to spread out the work over the course of a year to accommodate local staffing needs.

Analysis Plan

The original analysis plan for the STOP CRC trial called for a traditional random-effects analysis using logistic regression with adjustment for patient-level factors and controlling for within-clinic clustering. During the developmental phase of the trial, the study team began to consider whether their primary interest was the clinic-level impact of the intervention rather than the patient-level impact. The study team ultimately incorporated a clinic-level analytic approach into the analysis plan for the implementation phase of the trial.

The data from the trial were viewed in the context of a 2-level hierarchical model with patients clustered within clinics. The primary interest was the cross-sectional clinic-level data. In other words, to what extent did the intervention improve fecal testing completion rates at each clinic among patients who qualified for the intervention?

Because the study involved outreach to all eligible patients at each clinic, and because the study team did not want to weight data from larger and smaller clinics differentially, each clinic's data were aggregated initially into 8 separate screening rates (1 rate for each subgroup defined by age [50 to 64 years vs 65 years or older], sex [female vs male], and race/ethnicity [minority vs nonminority]. The resulting analytic data set thus consisted of 208 observations (26 clinics × 8 observations per clinic). Treating the resulting observations as approximately normally distributed, the study team had planned to use mixed-model analysis of covariance to estimate the screening probabilities as a function of intervention, age, sex, race/ethnicity, and baseline clinic screening rate, with clinic specified as a cluster variable.

Secondary analyses were to include, in turn, fixed-effect interactions of treatment with age, sex, and race/ethnicity to test the impact of the intervention in subgroups defined by these variables. Following Murray (1998), the latter analyses would also include the random-effect interactions of the covariates with clinic.

Analyses were to be done using the mixed command in Stata, which calculates maximum likelihood estimates assuming normally distributed residual errors and random effects. The study team also assumed an unstructured covariance matrix for the random effects.

Challenges

After recruitment of the analysis sample, 2 analytic challenges became apparent. First, the number of patients in the various age–sex–race/ethnicity subgroups varied markedly across clinics. This variation raised serious questions about the validity of the normal approximation and the homoscedastic variances. Second, preliminary analyses made clear that the intraclass correlation coefficient (ICC) was much higher than anticipated, even after adjustment for baseline clinic-level screening rates, and that the ICC did not decrease to acceptable levels unless the analysis adjusted for network in place of baseline clinic-level screening rate, as shown in Table 1.

Table 1. Intraclass Correlation Coefficients From Various Random-Effects Models

Modela ICC
Null model: pure ICC without covariate adjustment 0.094
Intervention 0.089
Intervention + network 0.051
Intervention + baseline NQF score 0.082
Intervention + network + baseline NQF score 0.045
Full model: intervention + network + age + male sex 0.050

Abbreviations: NQF, National Quality Forum; ICC, intraclass correlation coefficient.
a Only network and NQF score are clinic-level variables.

Solutions

In response to these challenges, the study statistician proposed to replace the original analysis plan described above with a person-based logistic model that weighted individual observations by 1/(clinic size). This approach seemed to be a natural extension of the original proposal that preserved equal weighting of clinic-level effects, allowed for more general modeling of patient-level covariate effects than would otherwise have been possible, and provided a modeling framework (the logistic link function) that better corresponded to the nature of the data.

Consistent with the focus on marginal effects, the revised analysis plan proposed to use generalized estimating equation (GEE) models that accounted for clinic-level clustering and used a robust covariance estimate. The analysis also included a bias correction for the variance to reflect the small number of clusters. The final model, fit using Stata, took the following form:

xtset clinic
xtgee resultever intv i.network age male corr(indep)
   [pweight=wtind], family(binomial) vce(robust) nmp

where intervention (intv) and male sex (male) were binary indicators of intervention clinics and male sex, respectively; age was a continuous variable; i.network was Stata syntax to treat network as a class variable and create the corresponding dummy indicators for each network; and nmp was the bias correction.

This model adjusted for age as a continuous variable and did not include an adjustment for race/ethnicity. (Race/ethnicity was missing for some participants, and the investigators wanted to include all participants in the primary analysis.) Although the nmp option in Stata may not have been the optimal variance bias adjustment (see previous guidance from the NIH Pragmatic Trials Collaboratory's Biostatistics and Design Core), it was the only available option in Stata for this particular model formulation.

The analysts used an independent (rather than exchangeable) correlation matrix to avoid overweighting of smaller clinics (Patrick Heagerty, PhD; personal communication). The analysts also fit several alternative models as sensitivity analyses. These models included GEE models with varying covariate adjustments, an unweighted GEE model (now using the exchangeable correlation matrix), and random-effects logistic models (Table 2), as well as ordinary linear regression models using the 26 observed clinic proportions as data points (Table 3). For the most part, the models gave the same message.

Table 2. Summary of Intervention Effects From the Primary Model and Various Sensitivity Analyses Using the Full Data Seta

Model ln(OR) SE Value OR (95% CI) Absolute Difference (95% CI), %
Primary model
Weighted GEE: intervention + network + age + male sex 0.3241 0.1511 .05 1.38 (1.01 to 1.90) 3.4 (0.1 to 6.8)
Sensitivity analyses
Weighted GEE: intervention + network 0.3239 0.1522 .05 1.38 (1.00 to 1.91) 3.4 (0.0 to 6.8)
Weighted GEE: intervention + network + age + male sex +  insurance status  (excludes some patients) 0.3160 0.1541 .06 1.37 (0.99 to 1.90) 3.4 (–0.1 to 6.8)
Unweighted GEE: intervention + network + age + male sex 0.3158 0.1464 .05 1.37 (1.01 to 1.87) 3.3 (0.1 to 6.5)
Unweighted RE: intervention + network + age + male sex 0.2806 0.1699 .12 1.32 (0.92 to 1.89) 2.9 (–0.8 to 6.6)
Unweighted RE: intervention + network 0.2794 0.1704 .12 1.32 (0.92 to 1.89) 2.9 (–0.9 to 6.6)

Abbreviations: CI, confidence interval; GEE, generalized estimating equation; ln(OR), natural logarithm of the odds ratio; OR, odds ratio; SE, standard error; RE, random effects model.

Table 3. Intervention Effects Calculated From 26 Clinic Means

Model Absolute Difference
Intervention–Control SE P Value
Intervention 3.6 2.3 .14
Intervention + network 3.5 2.0 .10
Intervention + network + age + male sexa 2.4 2.3 .31

Abbreviation: SE, standard error.
Male sex is percentage male and age is mean age.

The study team also took advantage of the fact that the intervention was rolled out to control clinics during the second year after randomization to conduct a stepped-wedge analysis. The outcome variable for this analysis was each clinic's National Quality Forum (NQF) score for colorectal cancer screening. The NQF score was calculated for the year before randomization and for each of the 2 years after randomization. Because the NQF measure estimates the proportion of all age-eligible patients who were up to date for screening, it included some patients who were not included in the analyses above (such as patients who underwent a colonoscopy during the previous 10 years who would have been considered covered for the full year and hence never appeared in the registry of patients needing screening). Therefore, the NQF measure might be expected to be less sensitive to intervention effects. Nevertheless, it is a highly policy-relevant metric, because it is what is likely to drive health plan managers to adopt the intervention.

Because the intervention clinics experienced sizeable delays between the time of randomization and when they actually rolled out the intervention, the analysis allowed for separate intervention effects in the first and second years after randomization, ostensibly reflecting "startup" effects and "ongoing" effects. Both the intervention clinics and the control clinics would contribute to estimation of the former effects, whereas only the intervention clinics would contribute to the latter effects. This analysis suggested similar startup and ongoing effects of 3.3 to 3.4 percentage points relative to baseline, in line with those reported above, though they were not statistically significant in this analysis.

Conclusion

The STOP CRC study team encountered substantial variation in patient-level demographic characteristics across study clinics and a high ICC. The study team overcame these challenges by using a person-based approach to modeling clinic-level intervention effects and by adjusting for health center (rather than specific health center characteristics). Sensitivity analyses suggested that the results were much the same as they would have been had the study team ignored the weighting or used random-effects models rather than GEE models. To improve the robustness of the findings, the study team conducted an analysis comparing NQF scores between the intervention and usual care groups.

SECTIONS

CHAPTER SECTIONS

REFERENCES

back to top

Murray DM. 1998. Design and Analysis of Group Randomized Trials. Oxford University Press, New York.


Version History

April 30, 2024: Made nonsubstantive changes to the text as part of the annual content update (changes made by D. Seils).

June 23, 2022: Updated the name of the NIH Collaboratory in the contributors list and made nonsubstantive changes to the text as part of the annual content update (changes made by D. Seils).

July 2, 2020: Minor corrections to layout and formatting (changes made by D. Seils).

May 27, 2020: Reordered the sections of this chapter as part the annual content update (changed made by D. Seils).

May 1, 2020: Made nonsubstantive changes to the Resources sidebar as part of the annual content update (changes made by D. Seils).

Published January 3, 2019

FAQ

Data Sharing and Embedded Research


Section 10


FAQ

Frequently Asked Questions

Question

Answer

I find that my institution is paranoid about data sharing. We realize that if you want to continue to work with your healthcare partners, you may not be able to include some information, such as site, in cases where it would be possible to surmise which site is which. With pragmatic research, we are asking healthcare systems to disclose information that their competitors don’t have to disclose, which leaves the systems open for comparisons. On the other hand, if you don’t share all the data, then this limits the usefulness of them. For example, other investigators may not be able to use the data to replicate the trial. This is an evolving conversation; we want people to share as much as they can and still have the data be useful.

SECTIONS

CHAPTER SECTIONS


Version History

Published December 17, 2018

Additional Resources

Data Sharing and Embedded Research


Section 9


Additional Resources

NIH Data Sharing Resources

National Institutes of Health (NIH) has services and platforms designed to help share, archive, and find products from research

Grand Rounds

September 27, 2019 Preparing for Clinical Trial Data Sharing and Re-use: The New Reality for Researchers (Rebecca Li, PhD, Frank Rockhold, PhD)
September 28, 2018 Assessing and Reducing Risk of Re-identification When Sharing Sensitive Research Datasets (Greg Simon, MD, MPH, Deven McGraw, JD, MPH, Khaled El Emam, PhD)
July 13, 2018 Clinical Trial Data Sharing: Perspectives from Participants and PCORI (Michelle M. Mello, JD, PhD, Steven Goodman, MD, MHS, PhD)
September 28, 2017 Assessing and reducing risk of re-identification when sharing sensitive research datasets (Gregory Simon, MD)

Podcasts

October 1, 2019 Preparing for Clinical Trial Data Sharing and Re-use: The New Reality for Researchers (Rebecca Li, PhD, Frank Rockhold, PhD)
July 17, 2018 Clinical Trial Participants’ Views of the Risks and Benefits of Data Sharing (Michelle Mello, JD, PhD)

News

August 13, 2018 JAMA Commentary Highlights the Value of Data Enclaves and Distributed Data Networks

SECTIONS

CHAPTER SECTIONS


Version History

April 4, 2021: Added Grand Rounds and information on NIH data sharing repositories (changes made by K. Staman).

Published December 17, 2018